
Image: Visual Overview of the HAVAL Hashing Process
Published: January 9, 2026 at 8:40:32 PM UTC
Last updated: January 9, 2026 at 8:40:52 PM UTC
Landscape infographic explaining the high-level flow of the HAVAL hash algorithm, from input message and data blocks through nonlinear operations, mixing, and compression to a final hash output.

Available versions of this image
The image files available for download below are less compressed and higher resolution - and as a result of that, higher quality - than the images embedded in articles and pages on this website, which are more optimized for file size in order to reduce bandwidth consumption.
Regular size (1,536 x 1,024)
Large size (3,072 x 2,048)
Very large size (4,608 x 3,072)
Extra large size (6,144 x 4,096)
Comically large size (1,048,576 x 699,051)
- Still uploading... ;-)
Image description
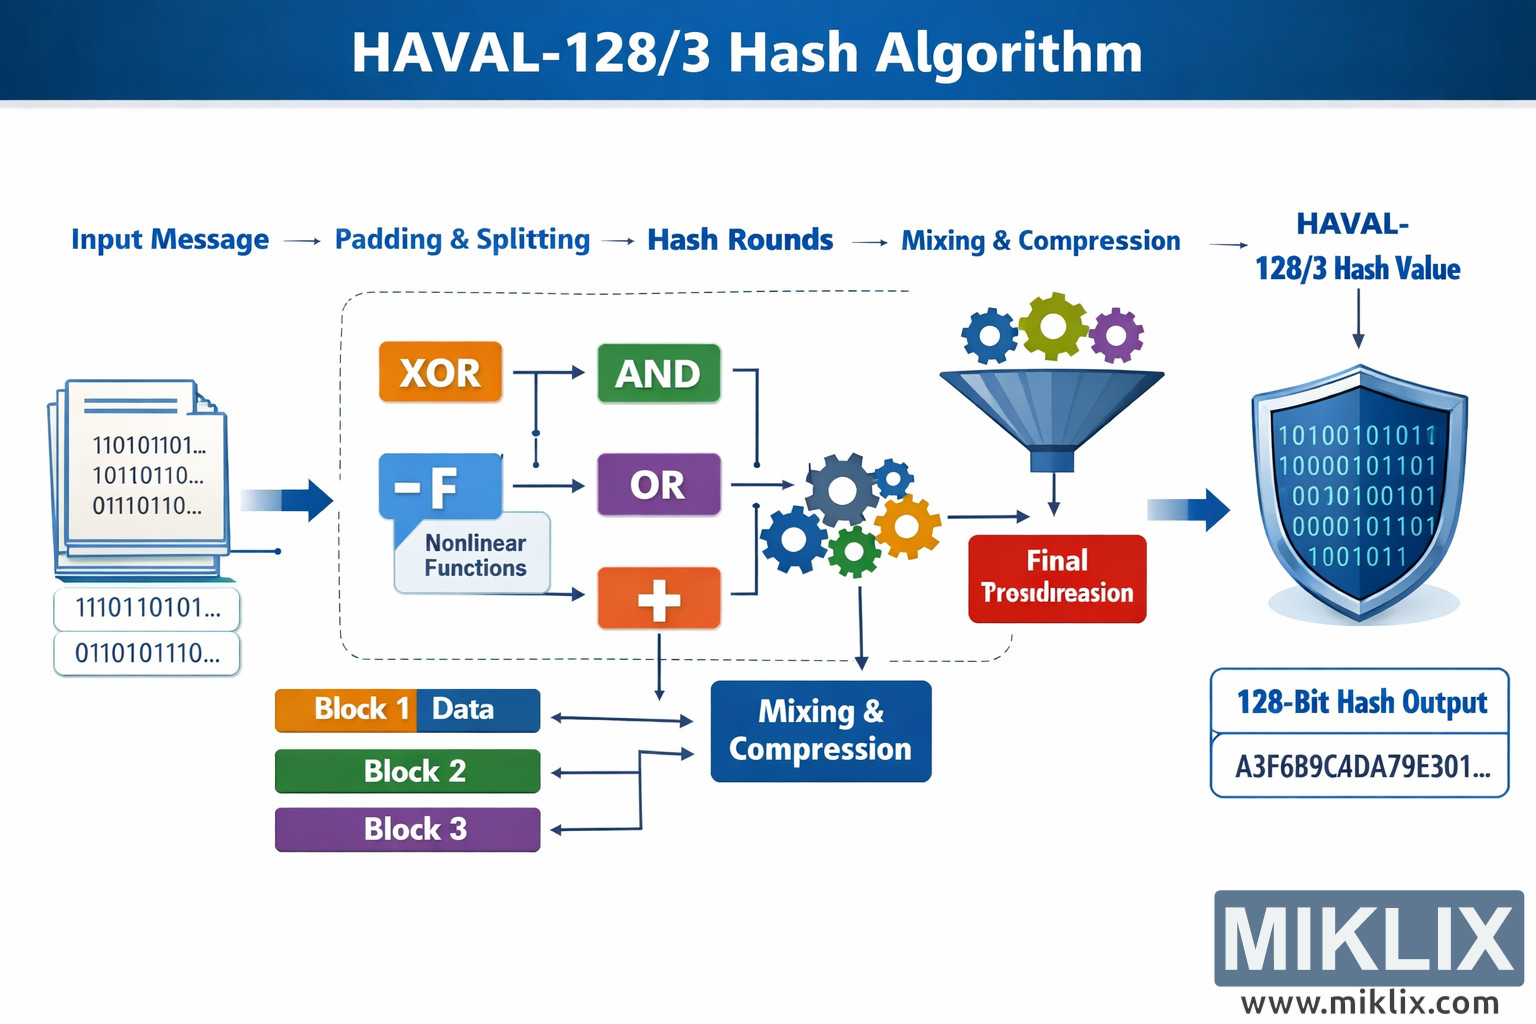
This landscape infographic provides a clean, high-level visualization of the HAVAL hash algorithm workflow, designed to be easy to understand without relying on precise numeric parameters. The composition is arranged from left to right, guiding the viewer through the transformation of an input message into a final cryptographic hash value. At the far left, a stack of document-like pages labeled with sample binary strings represents the original input message. Beneath this stack, a few smaller rounded boxes show fragments of binary-looking data, emphasizing that the message is first prepared and divided into manageable pieces. An arrow points from this input area toward the center of the diagram, where the main processing pipeline begins.
Across the top of the graphic runs a horizontal sequence of labeled stages, each separated by arrows: "Input Message" leads to "Padding & Splitting," then to "Hash Rounds," then to "Mixing & Compression," and finally to "HAVAL Hash Value." These labels act as a roadmap, summarizing the overall flow in plain language. The central area is enclosed by a dashed rounded rectangle, highlighting the internal operations performed repeatedly on each block of data.
Inside this dashed processing area are several colorful boxes representing different nonlinear and arithmetic-style operations used by the algorithm. A bright orange box labeled "XOR" appears near the top left of the processing area, connected by arrows to a green box labeled "AND" and a purple box labeled "OR." Slightly below these is a blue speech-bubble-style shape marked with "-F" and the caption "Nonlinear Functions," indicating that a family of complex logical functions is applied to the data. Below that, an orange box with a plus symbol represents addition or combination of values. The arrows between these boxes branch and rejoin, visually conveying that data flows through multiple logical transformations rather than a single straight path.
At the lower left of the dashed region, three horizontal bars labeled "Block 1 Data," "Block 2," and "Block 3" appear in different colors. These blocks are connected by arrows to a dark blue rectangular box labeled "Mixing & Compression," located toward the bottom center. This section shows how each prepared data block is fed into a mixing stage that blends the current block with the evolving internal state. Small gear icons in multiple colors sit near the right side of the dashed area, symbolizing internal state updates and iterative transformations.
From the mixing and compression area, an arrow leads upward to a funnel-shaped icon labeled as a final processing step, suggesting that all intermediate values are condensed into a single result. Below this funnel is a red box titled "Final Processing," reinforcing the idea that the algorithm performs a last combination phase. A bold arrow then points to the far right of the graphic, where a shield-shaped emblem contains rows of binary digits, representing the final hash value. Beneath this shield, a rounded rectangle displays an example alphanumeric hash-like string and the label "Hash Output," making it clear that the end product is a fixed-size digest.
Overall, the image uses clear arrows, distinct colors, and simple icons to communicate the conceptual stages of the HAVAL algorithm without overwhelming technical detail. The left-to-right layout, combined with the top summary labels and the dashed internal processing box, helps viewers quickly grasp how an input message is transformed through logical functions, mixing, and compression into a final cryptographic hash.
The image is related to: HAVAL-128/3 Hash Code Calculator