
Image: High-Level Visualization of the XXH-128 Hashing Pipeline
Published: January 9, 2026 at 8:44:41 PM UTC
Last updated: January 9, 2026 at 8:45:03 PM UTC
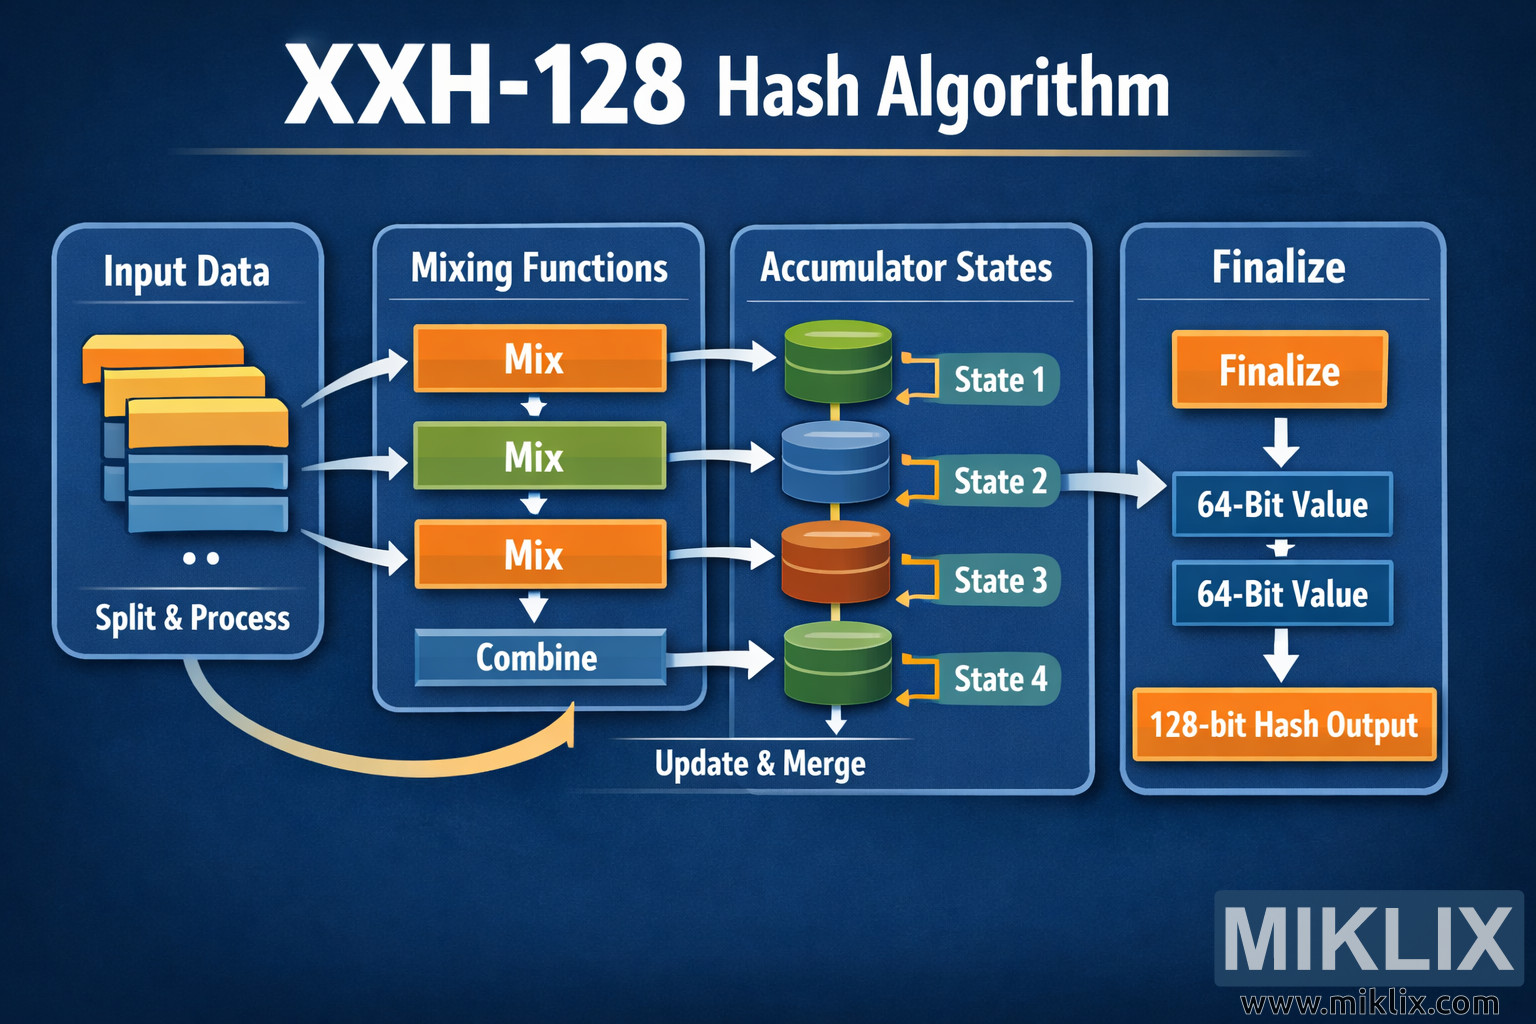
Clear, non-technical infographic explaining the high-level stages of the XXH-128 hashing process, from input splitting to a final 128-bit result.

Available versions of this image
The image files available for download below are less compressed and higher resolution - and as a result of that, higher quality - than the images embedded in articles and pages on this website, which are more optimized for file size in order to reduce bandwidth consumption.
Regular size (1,536 x 1,024)
Large size (3,072 x 2,048)
Very large size (4,608 x 3,072)
Extra large size (6,144 x 4,096)
Comically large size (1,048,576 x 699,051)
- Still uploading... ;-)
Image description
The image is a wide, landscape-oriented infographic titled "XXH-128 Hash Algorithm" displayed across the top in large white lettering against a dark blue gradient background. Below the title, the diagram is divided into four main vertical panels that guide the viewer from left to right through a simplified hashing pipeline. Each panel is enclosed in a rounded rectangle with a subtle glow, giving the layout a clean, modern dashboard appearance.
The first panel is labeled "Input Data" and shows a stack of layered, rectangular blocks in yellow, orange, and blue, representing chunks of incoming data. Beneath the blocks is the caption "Split & Process," indicating that the data is divided into pieces before being handled by the algorithm. White curved arrows point from this panel to the next one, emphasizing the flow direction.
The second panel is titled "Mixing Functions." Inside it are three horizontal boxes stacked vertically, each labeled "Mix" in bold white text. The top and bottom mix boxes are orange, while the middle one is green, visually reinforcing the idea of repeated, varied operations. Arrows connect these boxes downward, and at the bottom of the panel a wider blue bar labeled "Combine" indicates that the intermediate results are brought together. A large curved arrow loops from this panel toward the next, implying iterative or continuous processing.
The third panel is labeled "Accumulator States" and contains four cylindrical shapes arranged vertically, resembling database or memory icons. Each cylinder is a different color—green, blue, orange, and green again—and is tagged on the right with small labels: "State 1," "State 2," "State 3," and "State 4." Short arrows point into and out of these states, with a caption at the bottom reading "Update & Merge," suggesting that these internal states are updated as data flows through the system.
The final panel on the right is titled "Finalize." At the top is a bold orange button-like box labeled "Finalize." Beneath it are two stacked blue rectangles both labeled "64-Bit Value," representing two halves of the final result. These feed into a large orange box at the bottom that reads "128-bit Hash Output." A straight arrow connects each step vertically, clearly illustrating how the accumulated states are transformed into the final hash.
Overall, the color palette of blues, oranges, and greens, combined with rounded shapes and smooth arrows, creates an approachable, high-level visualization. The diagram avoids low-level technical details and instead focuses on the conceptual flow from input data, through mixing and accumulation, to a final 128-bit hash value.
The image is related to: XXH-128 Hash Code Calculator