
Bild: Leafy Greens Nutrition Comparison Infographic
Veröffentlicht:
Zuletzt aktualisiert: 12. Juli 2026 um 20:33:02 UTC
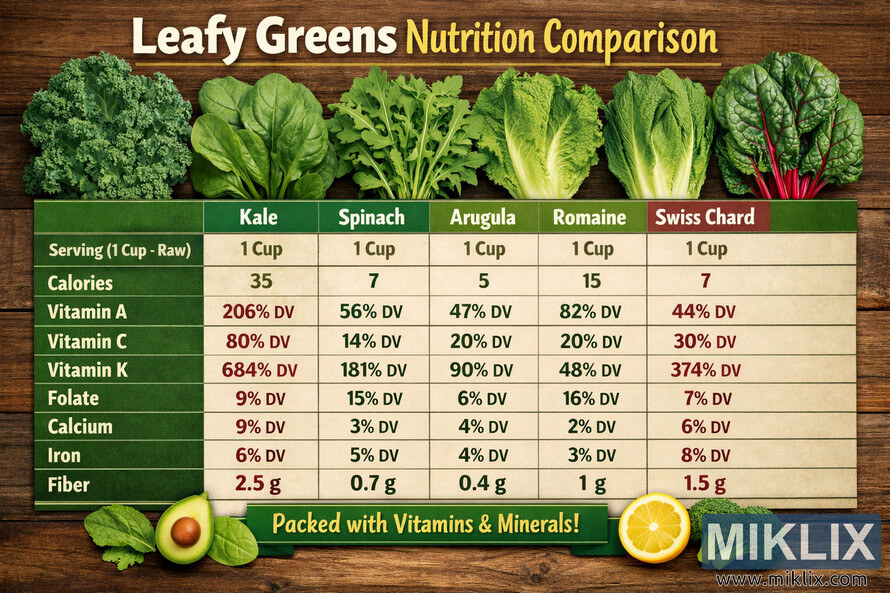
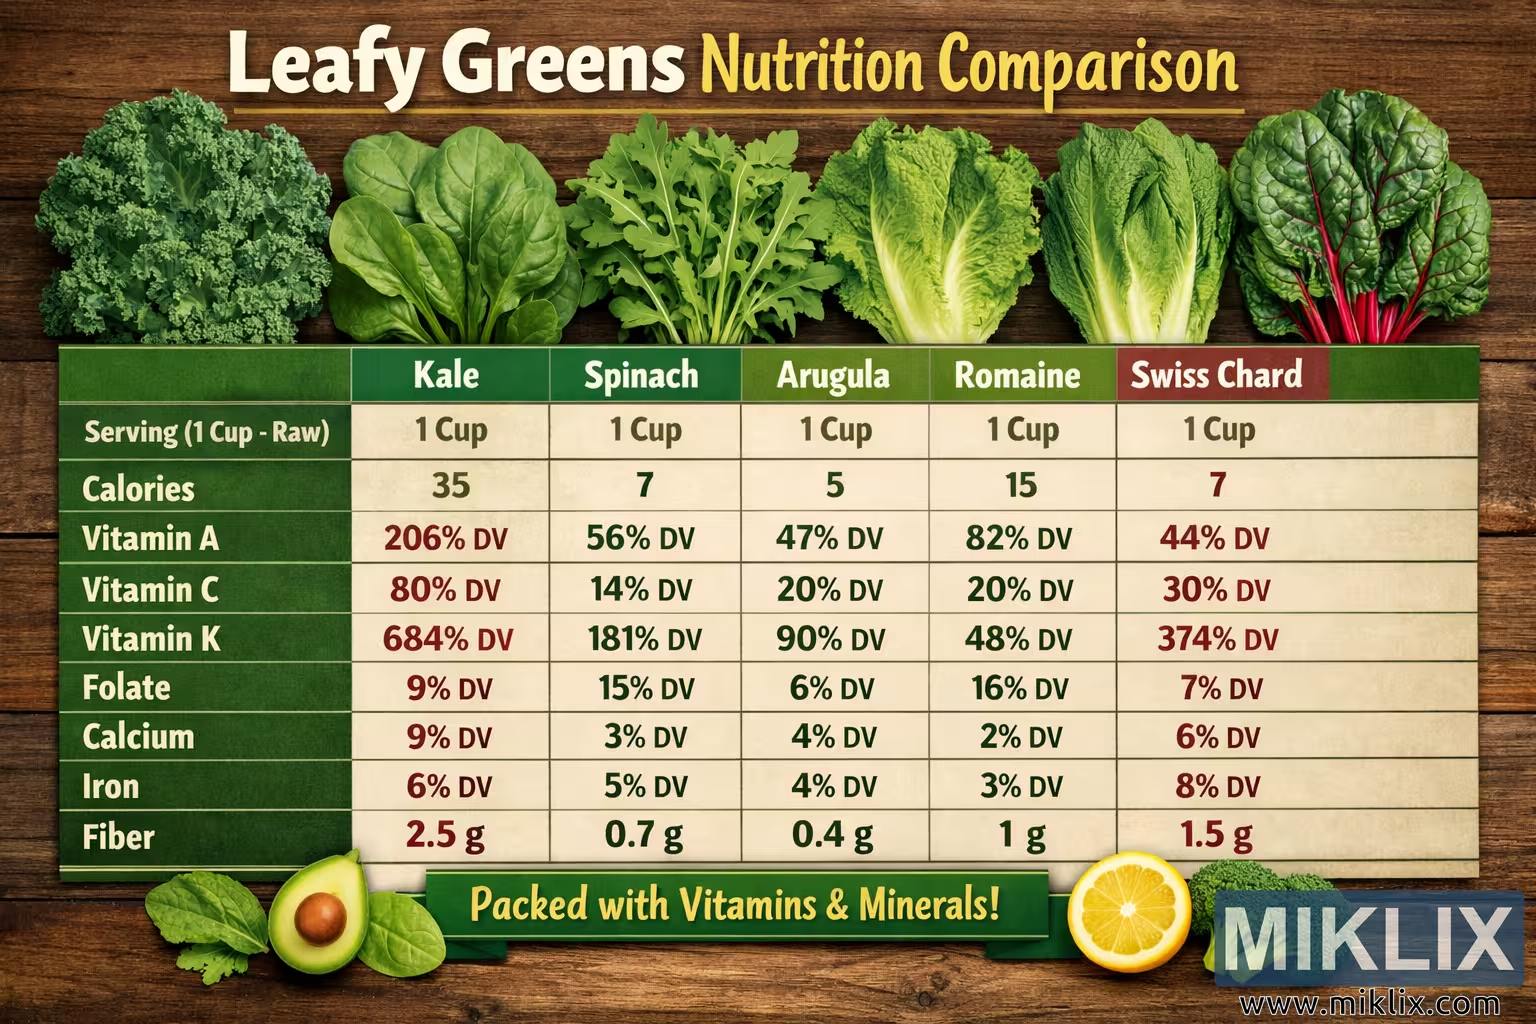
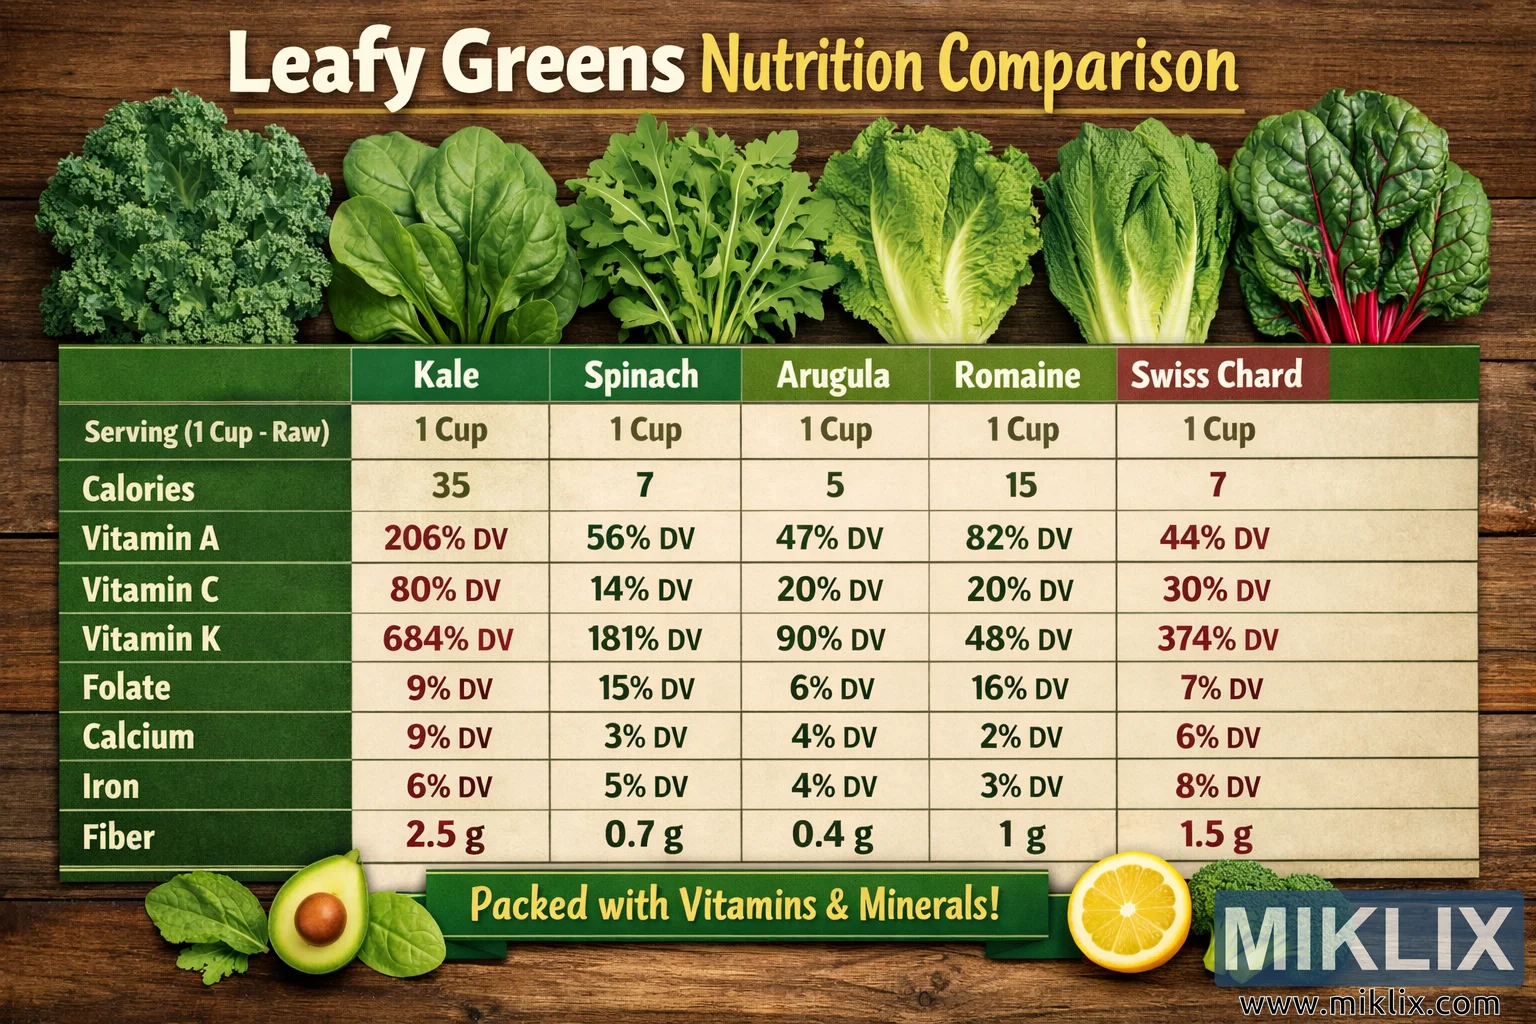
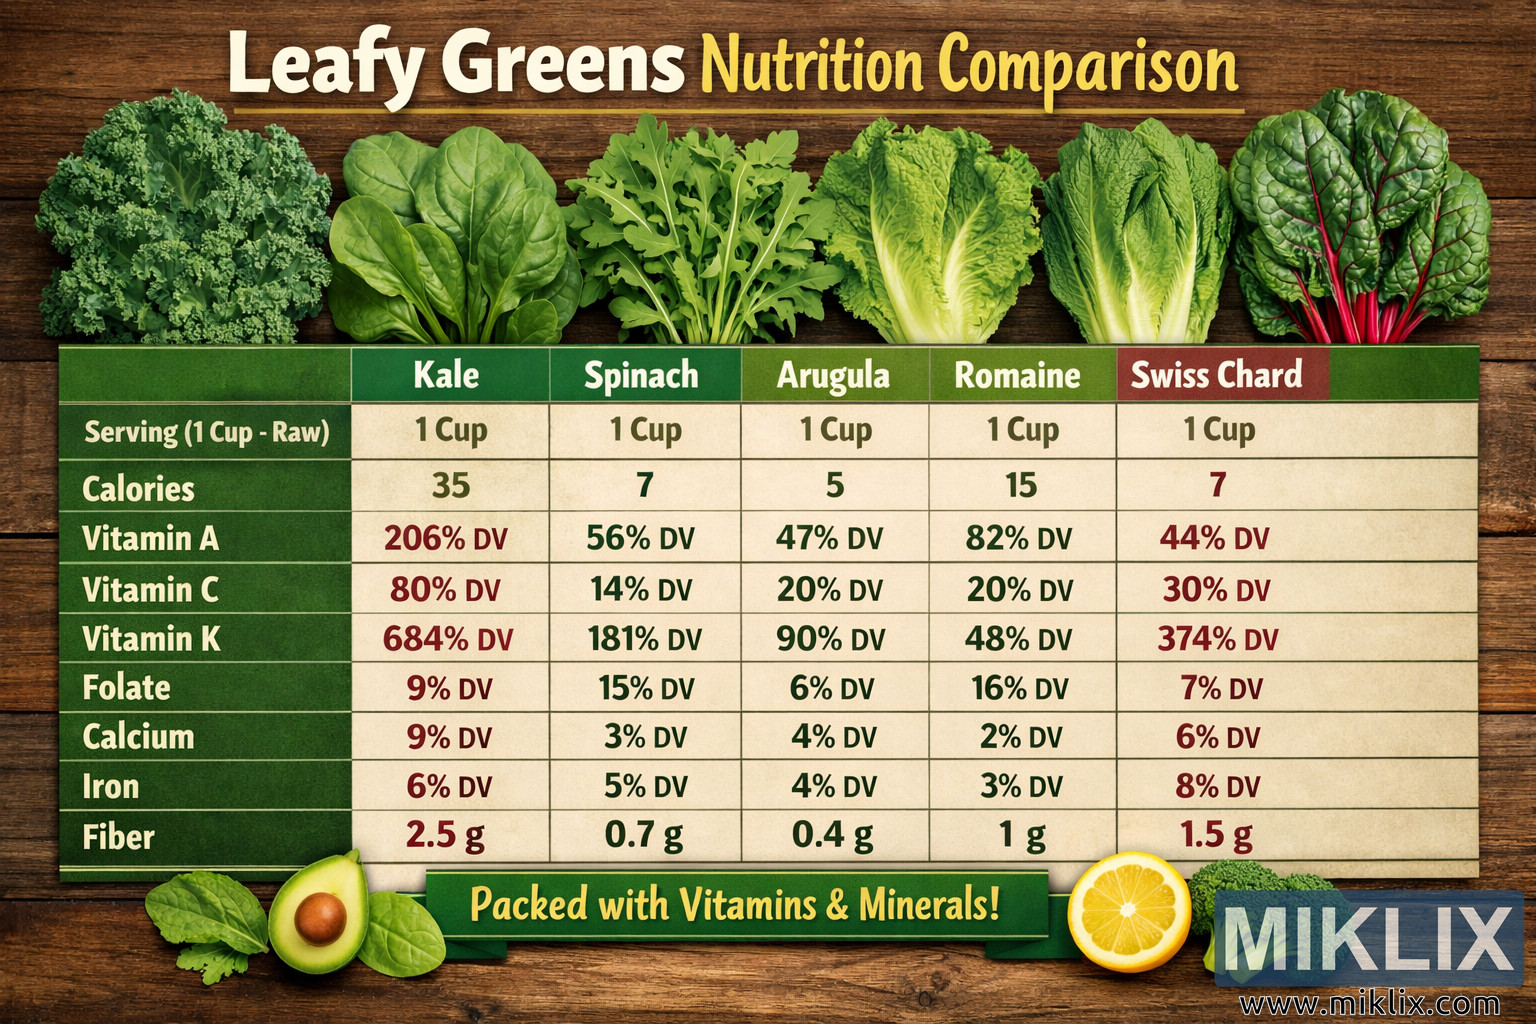
High-resolution infographic comparing the nutrition of kale, spinach, arugula, romaine, and Swiss chard. Includes calories, vitamins A, C, and K, folate, calcium, iron, and fiber per one-cup raw serving, presented in a clear side-by-side chart with fresh leafy green photos on a wooden background.
Leafy Greens Nutrition Comparison Infographic
Verfügbare Versionen dieses Bildes
Die Bilddateien, die unten zum Download zur Verfügung stehen, sind weniger komprimiert und haben eine höhere Auflösung - und damit eine höhere Qualität - als die Bilder, die in Artikeln und Seiten auf dieser Website eingebettet sind, die mehr auf Dateigröße optimiert sind, um den Bandbreitenverbrauch zu reduzieren.
Normale Größe (1,536 x 1,024)
Großes Format (3,072 x 2,048)
Sehr großes Format (4,608 x 3,072)
Extra großes Format (6,144 x 4,096)
Komisch große Größe (1,048,576 x 699,051)
- Ich lade immer noch hoch... ;-)
Bildbeschreibung
This image is a detailed, high-resolution landscape infographic that presents a side-by-side nutritional comparison of several popular leafy greens. The overall design is clean, vibrant, and visually engaging, intended to make complex nutritional information easy to understand at a glance while still offering enough depth for more careful reading.
At the very top of the image, centered horizontally, there is a bold title that reads "Leafy Greens Nutrition Comparison" in large, eye-catching letters. The words are rendered in a combination of white and yellow tones, which stand out clearly against a warm, wooden background. The wooden texture gives the infographic a natural, rustic feel, evoking the idea of fresh produce laid out on a kitchen table or a farmer’s market stall. The title is slightly stylized, but remains highly legible, immediately signaling to the viewer that the focus of the image is on comparing the nutritional qualities of different leafy vegetables.
Directly beneath the title, there is a horizontal row of photographs showing five distinct types of leafy greens. Each photo is neatly framed and aligned, creating a visually pleasing sequence from left to right. The greens are arranged in the following order: kale on the far left, followed by spinach, arugula, romaine, and finally Swiss chard on the far right. Each leafy green is presented in a fresh, appetizing state, with crisp leaves and rich color. Kale appears as dark, curly leaves; spinach is shown as smooth, deep green leaves; arugula has more delicate, slightly jagged leaves; romaine is depicted with elongated, pale green leaves and a firm structure; and Swiss chard is shown with broad green leaves and striking red stems that add a pop of color to the composition.
Below each photograph, there is a label indicating the name of the leafy green. These labels use a mix of green, white, and yellow headings, ensuring that the text is easy to read while maintaining a cohesive color palette that matches the overall theme of freshness and health. The names "Kale," "Spinach," "Arugula," "Romaine," and "Swiss Chard" are clearly separated into columns, each corresponding to the photo above and the nutritional data below.
Underneath the row of images and labels, the main body of the infographic is structured as a table. On the far left side of the table, there is a vertical green column listing the nutrient categories. This column acts as a legend for the rows of data that stretch horizontally across the chart. The nutrient categories are written in white text and include: "Serving (1 Cup - Raw)," "Calories," "Vitamin A," "Vitamin C," "Vitamin K," "Folate," "Calcium," "Iron," and "Fiber." The green background of this column contrasts with the lighter tones used in the rest of the table, making the nutrient labels stand out clearly and helping viewers quickly identify which row corresponds to which nutrient.
To the right of this nutrient column, the table is divided into five vertical sections, one for each leafy green. Each section contains numerical values or percentages that represent the nutritional content of a one-cup raw serving of that particular vegetable. The layout is grid-like, with horizontal lines subtly separating each row, giving the chart a structured, organized appearance.
In the "Serving (1 Cup - Raw)" row, each column simply states "1 Cup" beneath the corresponding leafy green photo, reinforcing that the comparison is based on equal serving sizes. This helps viewers understand that the differences in calories, vitamins, and minerals are due to the inherent properties of each vegetable rather than varying portion sizes.
The next row, labeled "Calories," shows how energy-dense each leafy green is. Kale is listed with "35" calories, spinach with "7," arugula with "5," romaine with "15," and Swiss chard with "7." These values highlight that most leafy greens are relatively low in calories, with kale being the most calorie-dense among the five, while arugula and spinach are particularly light.
The subsequent rows focus on key vitamins and minerals. In the "Vitamin A" row, the chart uses percentage values of the daily value (DV). Kale is shown as providing "206% DV," spinach "56% DV," arugula "47% DV," romaine "82% DV," and Swiss chard "44% DV." This row visually emphasizes that kale and romaine are especially rich sources of vitamin A, which is important for vision, immune function, and skin health.
The "Vitamin C" row similarly lists percentages of daily value: kale at "80% DV," spinach at "14% DV," arugula at "20% DV," romaine at "20% DV," and Swiss chard at "30% DV." These values suggest that kale and Swiss chard are particularly strong contributors of vitamin C, while spinach provides a more modest amount.
In the "Vitamin K" row, the numbers are strikingly high for some greens. Kale is listed at "684% DV," spinach at "181% DV," arugula at "90% DV," romaine at "48% DV," and Swiss chard at "374% DV." This row visually underscores that leafy greens, especially kale and Swiss chard, can be extremely rich in vitamin K, which plays a crucial role in blood clotting and bone health.
The "Folate" row shows more moderate percentages: kale at "9% DV," spinach at "15% DV," arugula at "6% DV," romaine at "16% DV," and Swiss chard at "7% DV." Here, romaine and spinach stand out as slightly better sources of folate, a B vitamin important for cell division and the prevention of certain birth defects.
The "Calcium" row lists: kale "9% DV," spinach "3% DV," arugula "4% DV," romaine "2% DV," and Swiss chard "6% DV." These values highlight that kale and Swiss chard offer more calcium than the other greens in this comparison, though all contribute at least a small amount.
In the "Iron" row, the chart shows kale at "6% DV," spinach at "5% DV," arugula at "4% DV," romaine at "3% DV," and Swiss chard at "8% DV." Swiss chard appears as the strongest source of iron among the five, with kale and spinach also providing notable amounts.
Finally, the "Fiber" row lists the grams of dietary fiber per cup: kale at "2.5 g," spinach at "0.7 g," arugula at "0.4 g," romaine at "1 g," and Swiss chard at "1.5 g." This row visually communicates that kale and Swiss chard are particularly beneficial for fiber intake, which supports digestive health and can help with satiety.
At the bottom of the chart, spanning the width of the infographic, there is a green banner with bold yellow text that reads "Packed with Vitamins & Minerals!" This banner serves as a concluding statement, reinforcing the overall message that leafy greens are nutrient-dense foods that can play a valuable role in a healthy diet. The color choice of green and yellow maintains the visual theme of freshness and vitality.
Beneath this banner, there are small illustrations of other healthy foods: a cut avocado, a sliced lemon, and a piece of broccoli. These illustrations are arranged in a subtle, decorative manner, adding visual interest without distracting from the main comparison chart. They help convey a broader sense of wholesome eating and balanced nutrition, suggesting that leafy greens can be part of a diverse, colorful plate.
The lighting throughout the image is even and well-balanced, ensuring that all text and visual elements are clearly visible. The colors are rich but not overly saturated, with greens, yellows, and earthy tones dominating the palette. The wooden background adds warmth and texture, while the structured table and clean typography give the infographic a professional, polished look. The overall composition is harmonious, with the title, photos, table, and banner all aligned in a way that guides the viewer’s eye naturally from top to bottom.
In summary, this infographic provides a comprehensive, visually appealing overview of the nutritional differences between kale, spinach, arugula, romaine, and Swiss chard. It highlights key nutrients such as calories, vitamins A, C, and K, folate, calcium, iron, and fiber, making it a useful reference for anyone interested in comparing leafy greens and making informed choices about which ones to include in their meals.
Das Bild ist verwandt mit: Bok Choy Health Benefits: Transform Your Diet with This Nutritional Powerhouse