
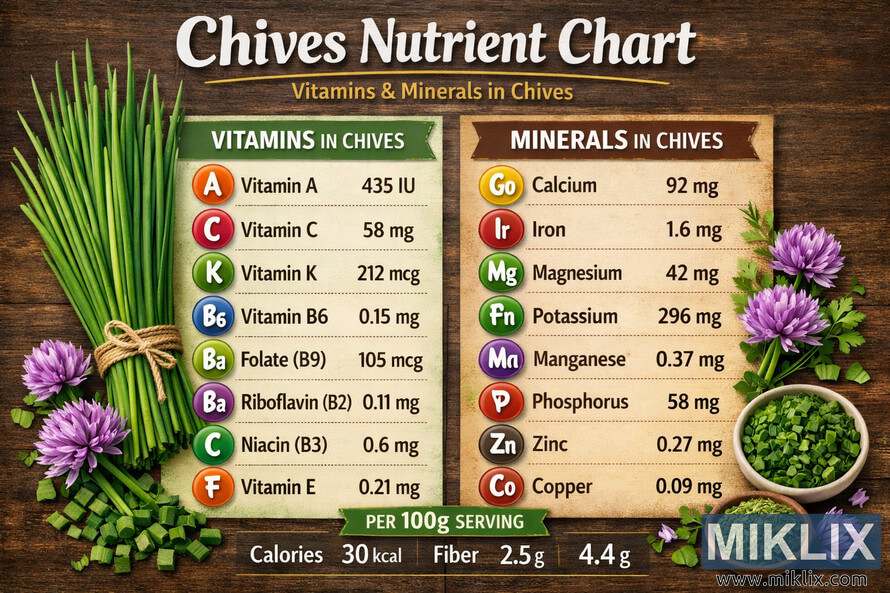
Hoto: Chives Nutrient Composition Chart
Buga:
An sabunta ta ƙarshe: 16 Yuli, 2026 da 20:45:26 UTC
Explore the detailed nutritional composition of chives in this infographic, highlighting vitamins, minerals, and key nutrient values per 100g serving. Perfect for understanding the health benefits of chives.
Chives Nutrient Composition Chart
Sigar da ake da ita ta wannan hoton
Fayilolin hotunan da ake da su don saukewa a ƙasa ba su da matsewa kuma suna da ƙuduri mafi girma - kuma sakamakon haka, inganci mafi girma - fiye da hotunan da aka saka a cikin labarai da shafuka akan wannan gidan yanar gizon, waɗanda aka fi inganta su don girman fayil don rage yawan amfani da bandwidth.
Girman yau da kullun (1,536 x 1,024)
Babban girma (3,072 x 2,048)
Girma mai girma sosai (4,608 x 3,072)
Girman da ya fi girma (6,144 x 4,096)
Girman barkwanci mai girma (1,048,576 x 699,051)
- Har yanzu ana lodawa... ;-)
Bayanin Hoto
The image is a meticulously designed landscape infographic titled "Chives Nutrient Chart," which visually presents the nutritional composition of chives in a clear, engaging, and educational format. The chart is divided into two main sections—vitamins and minerals—each enclosed within distinct bordered boxes that help separate the categories while maintaining a cohesive design. The background features a warm, wooden texture that evokes a natural, rustic kitchen setting, reinforcing the organic theme of the subject matter.
At the top of the image, the title "Chives Nutrient Chart" is displayed in large, bold, white and yellow letters, immediately drawing attention. Beneath the title, the subtitle "Vitamins & Minerals in Chives" appears in smaller yellow text, providing context for the viewer. To the left of the chart, a photo-realistic bundle of fresh chives tied with twine rests on the wooden surface, accompanied by delicate purple chive flowers and chopped chives scattered nearby. This visual element adds realism and aesthetic appeal, grounding the infographic in the tangible appearance of the herb itself.
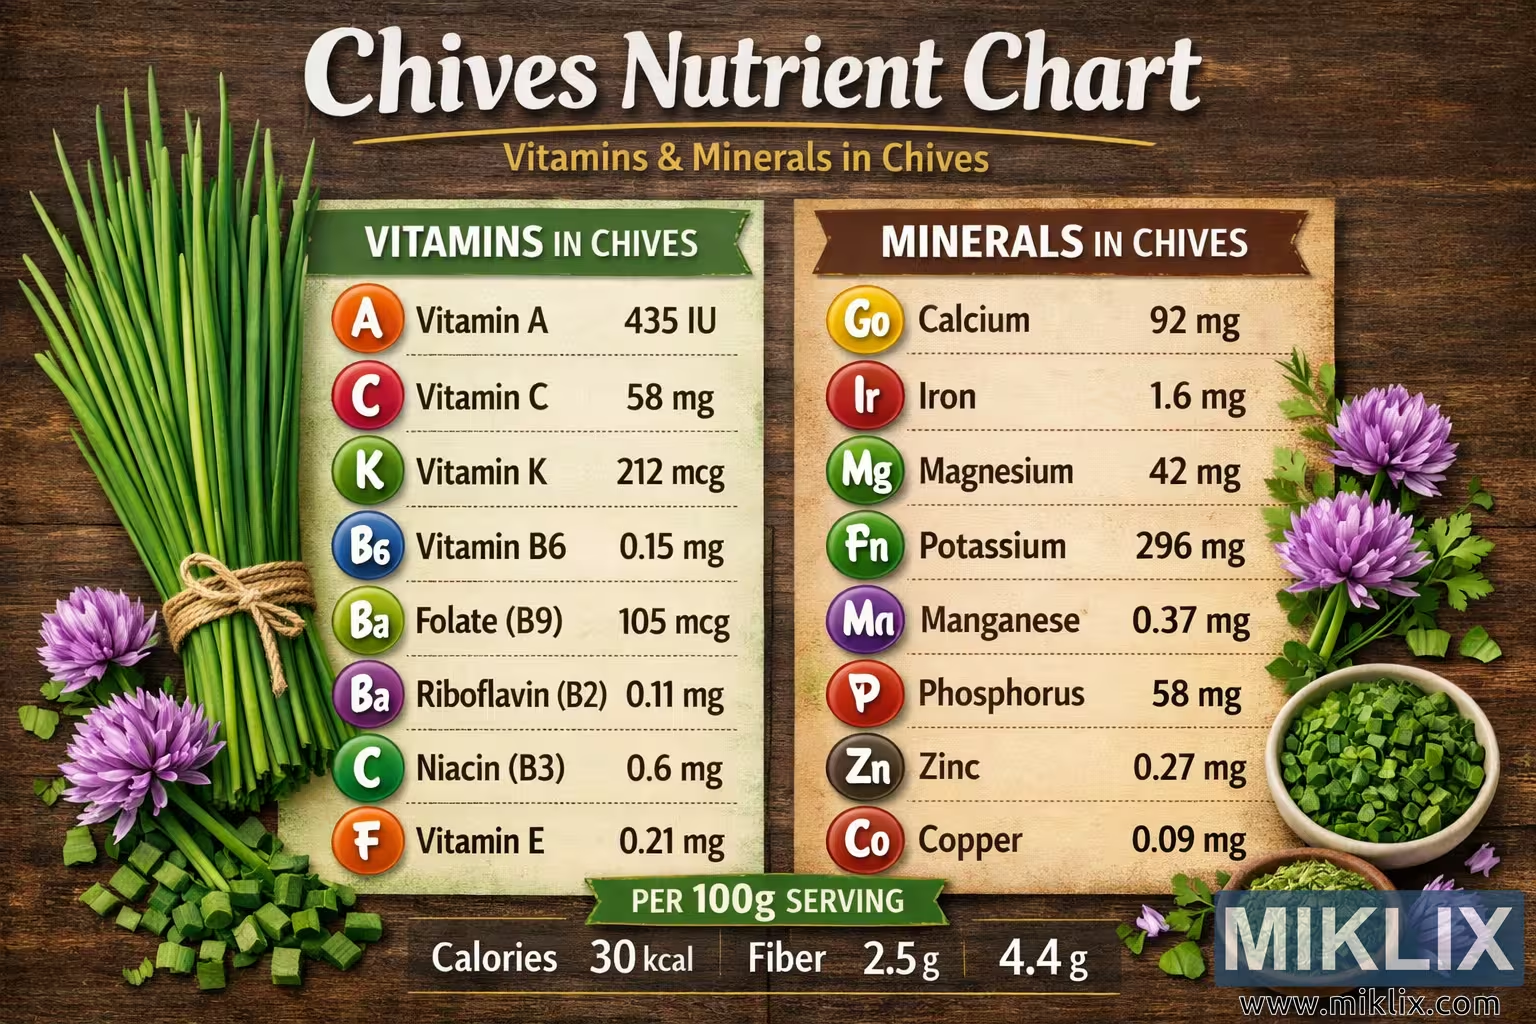
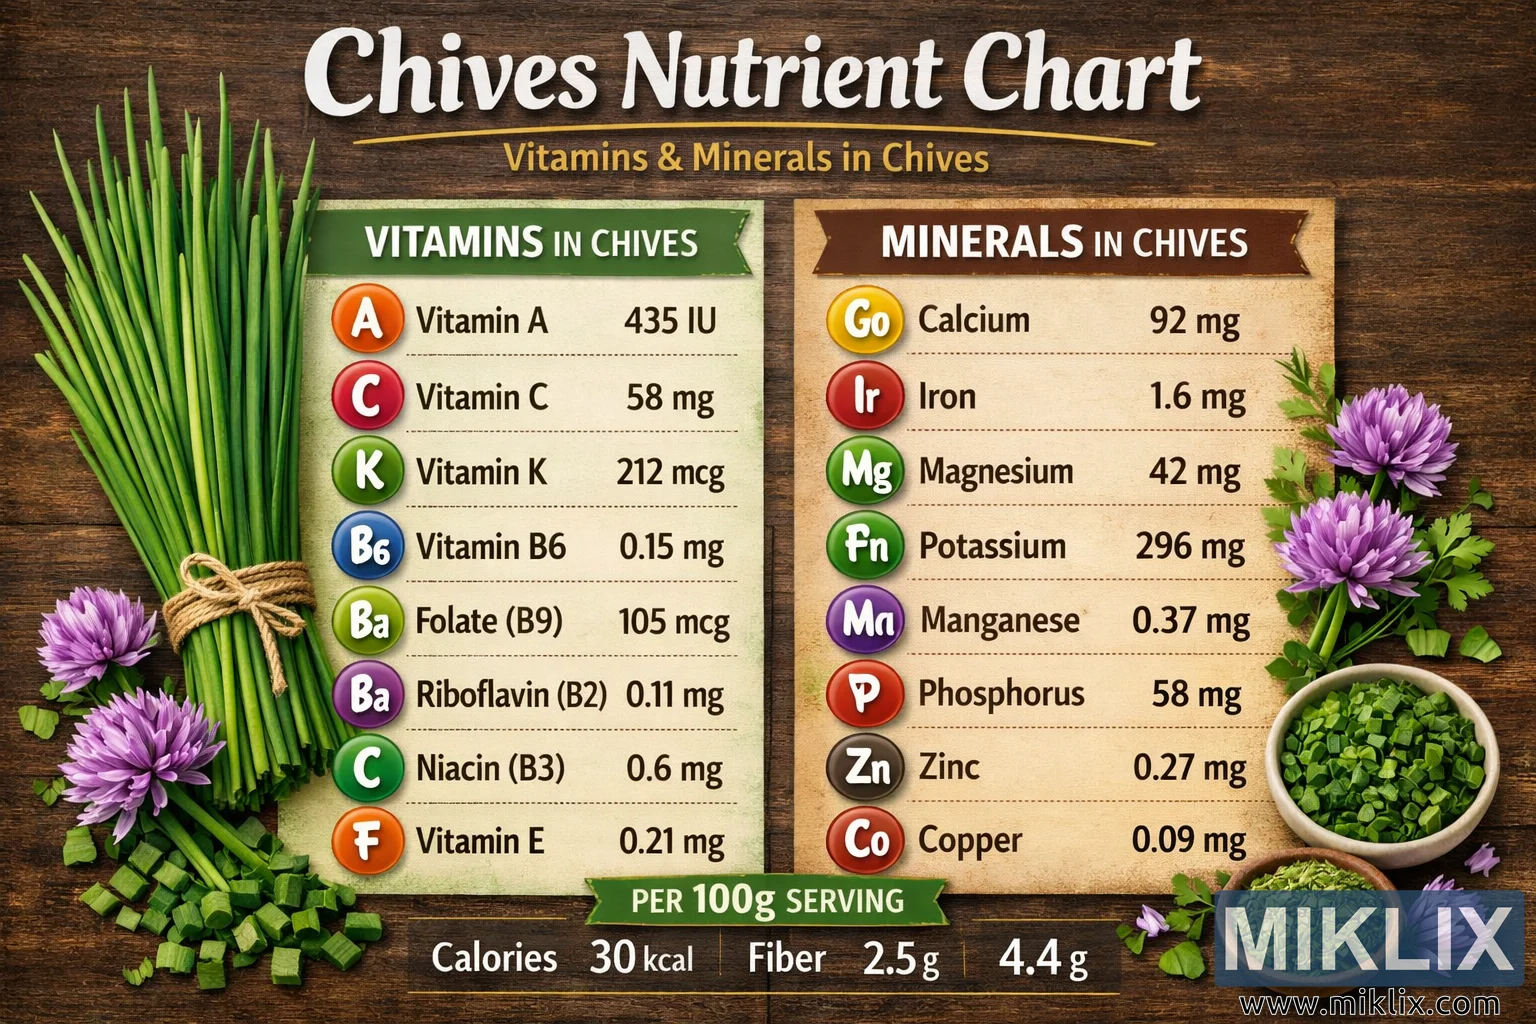
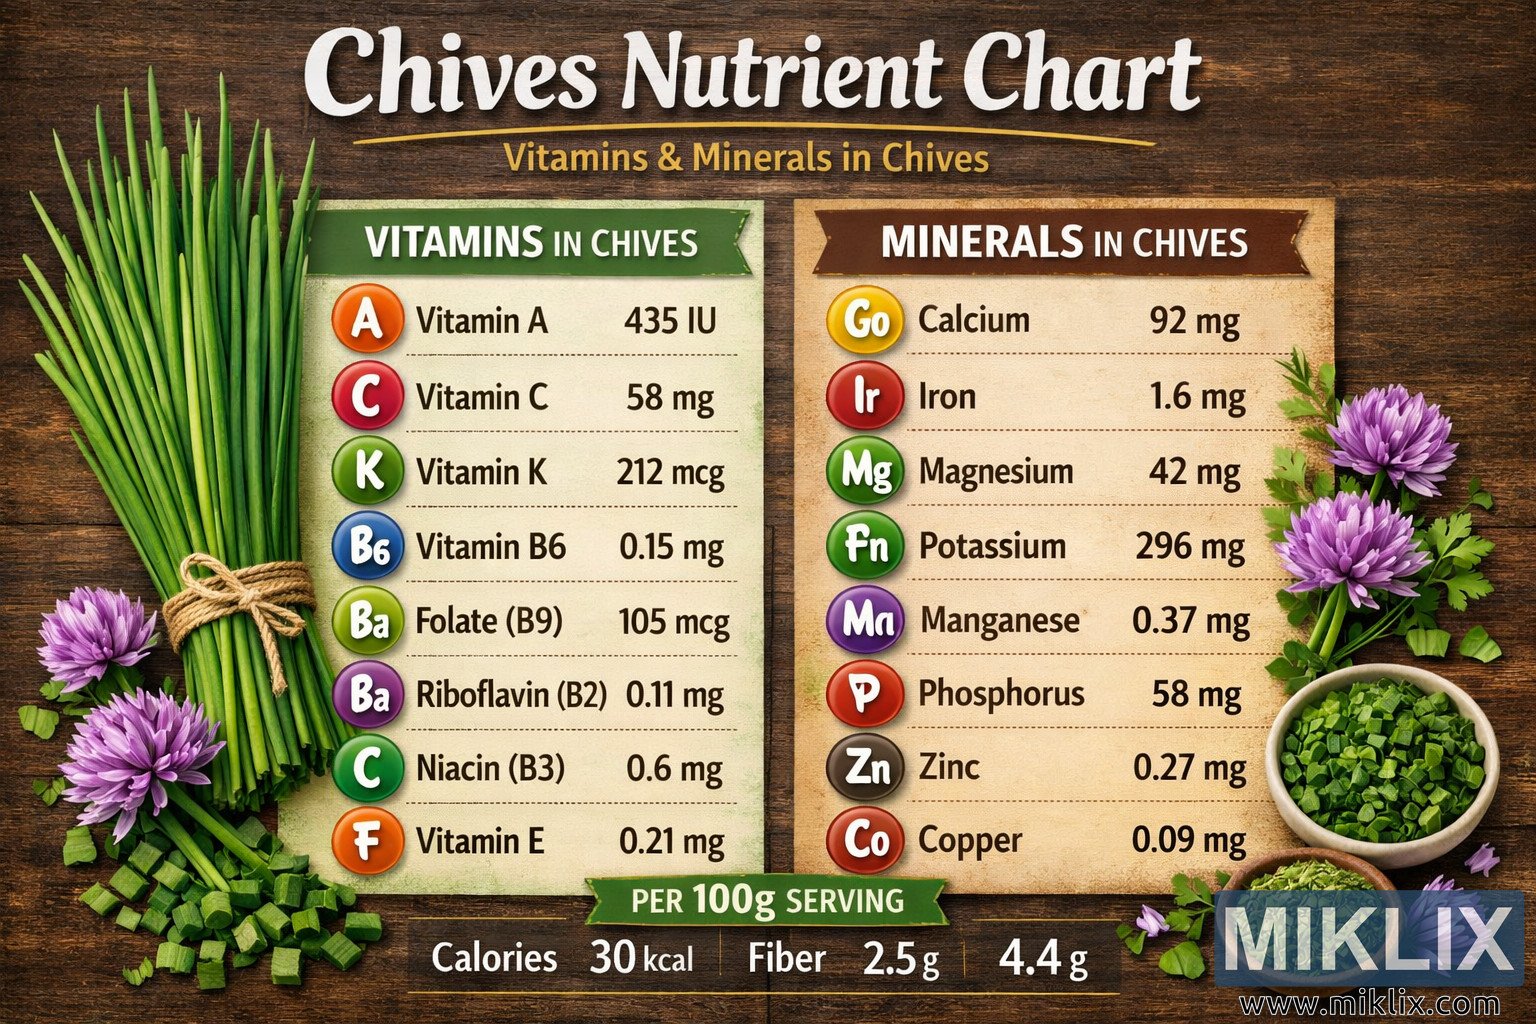
The left section, labeled "VITAMINS IN CHIVES," is framed by a green border symbolizing freshness and vitality. Inside this section, eight circular icons are arranged vertically, each representing a specific vitamin found in chives. Each icon is color-coded for easy differentiation and includes both the vitamin name and its quantity per 100 grams. From top to bottom, the vitamins listed are: Vitamin A (435 IU), Vitamin C (58 mg), Vitamin K (212 mcg), Vitamin B6 (0.15 mg), Folate (B9) (105 mcg), Riboflavin (B2) (0.11 mg), Niacin (B3) (0.6 mg), and Vitamin E (0.21 mg). The use of circular icons and bright colors makes the information visually accessible and memorable, while the vertical arrangement ensures clarity and balance.
On the right side, the "MINERALS IN CHIVES" section mirrors the design of the vitamin section but uses a brown border to evoke earthy tones associated with minerals and soil. Eight circular icons are similarly arranged vertically, each representing a mineral and its corresponding amount per 100 grams. The minerals listed are: Calcium (92 mg), Iron (1.6 mg), Magnesium (42 mg), Potassium (296 mg), Manganese (0.37 mg), Phosphorus (58 mg), Zinc (0.27 mg), and Copper (0.09 mg). The color palette for these icons leans toward muted, natural hues, complementing the earthy theme and balancing the vibrancy of the vitamin section.
At the bottom center of the infographic, a green banner reads "PER 100g SERVING" in bold white text, serving as a unifying element between the two sections. Below this banner, three key nutritional values are displayed: Calories (30 kcal), Fiber (2.5 g), and Carbs (4.4 g). These values provide a quick reference for the macronutrient composition of chives, rounding out the detailed micronutrient information above.
The overall composition of the image is symmetrical and well-balanced, with the visual weight evenly distributed between the left and right sections. The typography is clean and legible, using a mix of serif and sans-serif fonts to create hierarchy and readability. The color scheme—dominated by greens, browns, yellows, and natural wood tones—reinforces the organic and wholesome nature of the subject. Small bowls containing dried chives and chive flowers are placed on the lower right side, adding texture and visual interest without distracting from the main data.
The infographic succeeds in combining scientific accuracy with aesthetic appeal. It communicates complex nutritional data in a format that is both visually engaging and easy to understand. The design choices—such as the use of color-coded icons, clear labeling, and realistic imagery—make the chart suitable for educational, culinary, or health-related contexts. The image conveys a sense of freshness, balance, and natural goodness, effectively illustrating the rich vitamin and mineral profile of chives while maintaining a professional and polished appearance.
Every element of the composition contributes to the viewer’s understanding of chives as a nutrient-dense herb. The wooden background and natural imagery evoke a connection to gardening and cooking, while the structured layout ensures that the scientific data remains the focal point. The result is a harmonious blend of information and artistry that celebrates both the beauty and the health benefits of chives.
Hoton yana da alaƙa da: Health Benefits of Chives: Nature's Nutritional Powerhouse