
Image: Visual Guide to Eller’s Maze Generation Algorithm
Published: January 10, 2026 at 8:10:34 PM UTC
Last updated: January 10, 2026 at 8:10:53 PM UTC
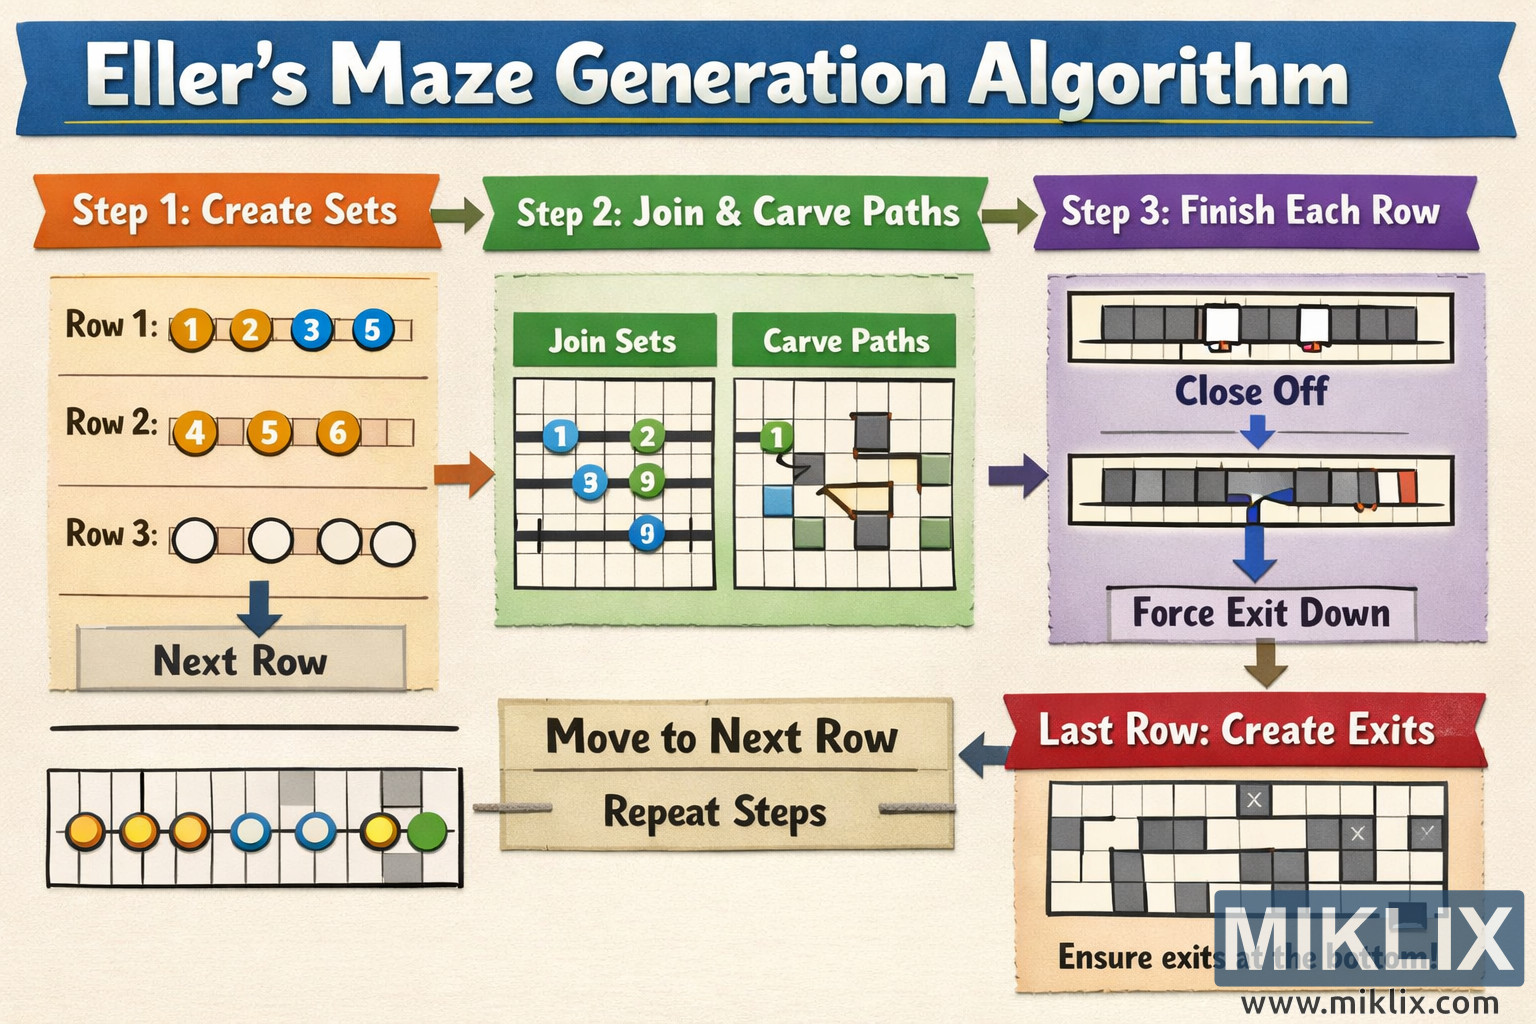
An easy to understand infographic visualizing Eller’s maze generation algorithm, illustrating how sets are created, connected, and carried forward row by row to build a maze.

Available versions of this image
The image files available for download below are less compressed and higher resolution - and as a result of that, higher quality - than the images embedded in articles and pages on this website, which are more optimized for file size in order to reduce bandwidth consumption.
Regular size (1,536 x 1,024)
Large size (3,072 x 2,048)
Very large size (4,608 x 3,072)
Extra large size (6,144 x 4,096)
Comically large size (1,048,576 x 699,051)
- Still uploading... ;-)
Image description
The image is a wide, landscape oriented educational infographic titled \"Eller’s Maze Generation Algorithm\" displayed in a large banner at the top. The design uses a clean grid background and bright, distinct colors to separate each phase of the process. The layout reads from top to bottom, showing how the algorithm operates on one row of cells at a time to gradually construct a full maze.
The first section is labeled \"1. Create Sets\" and shows a single horizontal row of square maze cells. Each cell contains a colored block with a small number, representing that every cell in the row is assigned to a set. The colors indicate that some neighboring cells share the same set, while others belong to different sets, visually explaining that sets track which cells are already connected. Arrows indicate that this row is the starting point for all subsequent operations.
The second section, \"2. Add Horizontal Walls\", shows the same row but now with some dividing lines between adjacent cells. These lines represent walls that may or may not be placed between neighboring cells. The diagram emphasizes that these walls are chosen in a controlled but non-deterministic way, so that some sets merge horizontally while others remain separated. Labels and arrows clarify that this step prevents creating loops while still allowing some adjacent sets to be joined.
In the third section, \"3. Add Vertical Connections\", downward arrows extend from selected cells into the next row. These arrows represent vertical passages that connect a cell to the row below. The graphic highlights that at least one vertical connection is created for every set, ensuring that no set becomes isolated when moving downward. The colored blocks are carried through these vertical links, illustrating how set membership propagates into the next row.
The fourth section, \"4. Generate New Row\", displays a fresh row of empty cells beneath the previous one. Some cells inherit set colors through the vertical connections, while others are blank, indicating that they will be assigned new set identifiers. A note below the row explains that the process repeats: new sets are created where needed, horizontal walls are added again, and vertical connections are chosen once more.
Across the entire infographic, arrows and short captions such as \"Repeat Process\" and \"Merge & Create Sets\" visually guide the viewer in a loop, reinforcing that the algorithm works row by row until the maze is complete. The final impression is a clear, friendly walkthrough that avoids implementation details while making the core idea of Eller’s algorithm—managing sets, joining them horizontally, and guaranteeing vertical continuity—easy to understand at a glance.
The image is related to: Eller's Algorithm Maze Generator