
Hình ảnh: Melon Nutrition Comparison Infographic
Đã xuất bản:
Cập nhật lần cuối: lúc 14:17:41 UTC 20 tháng 8, 2026
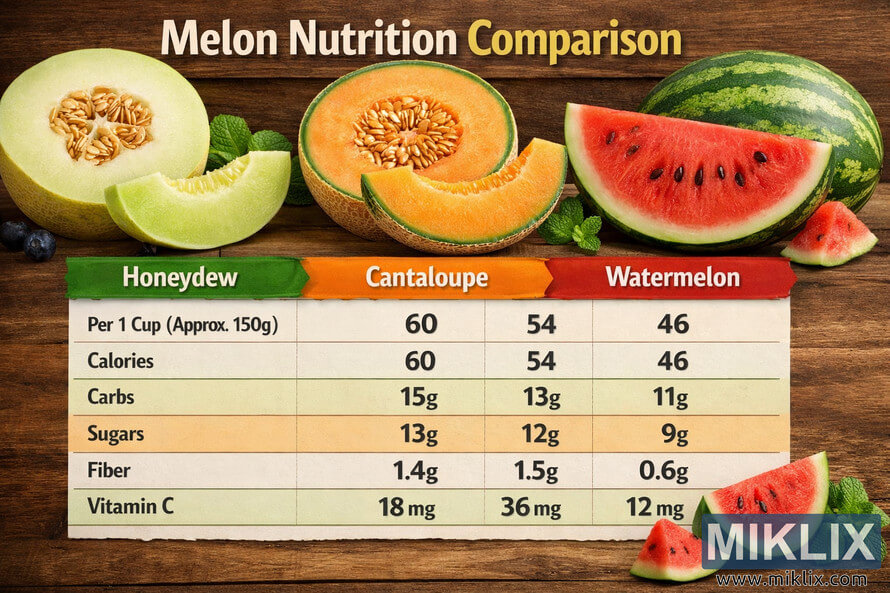
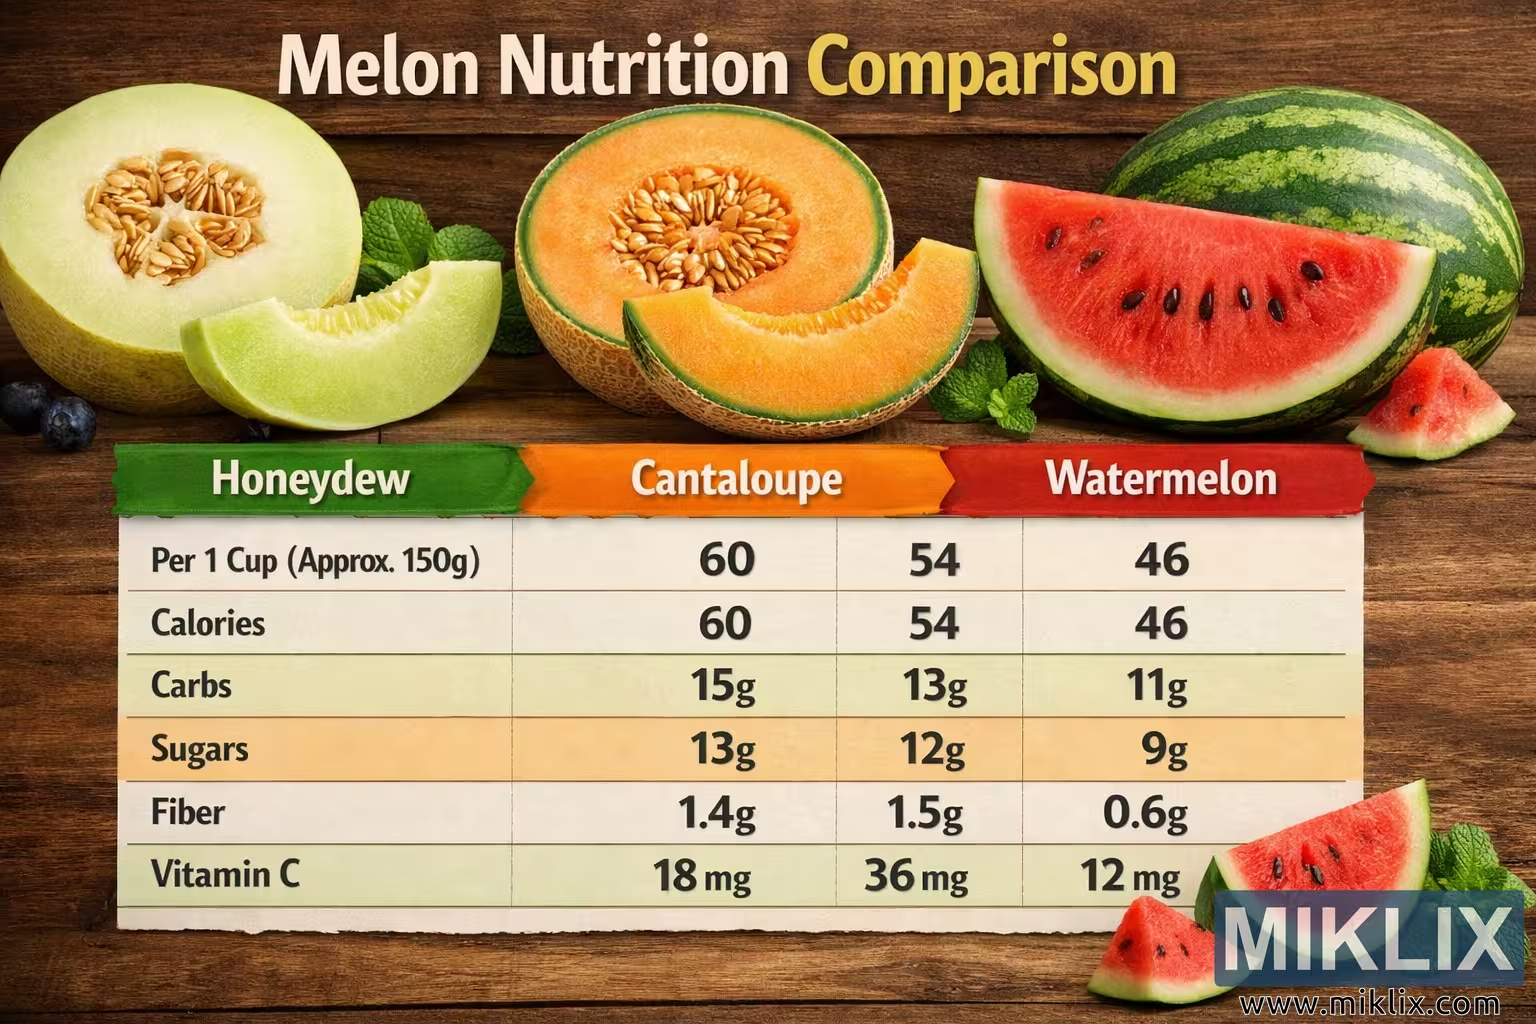
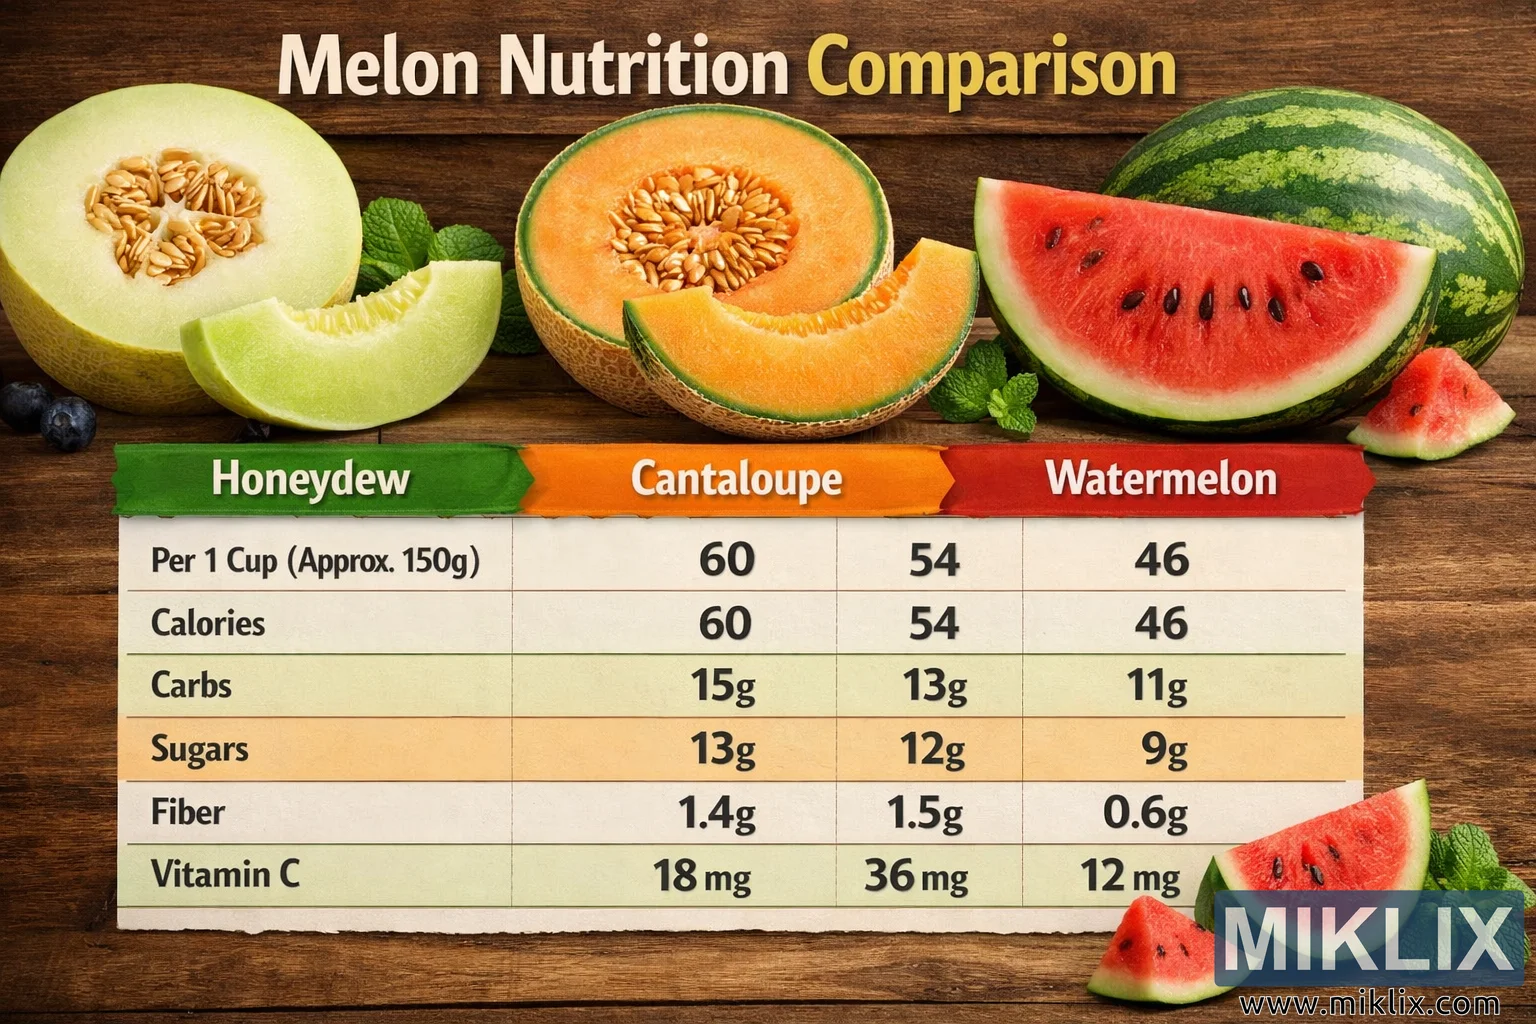
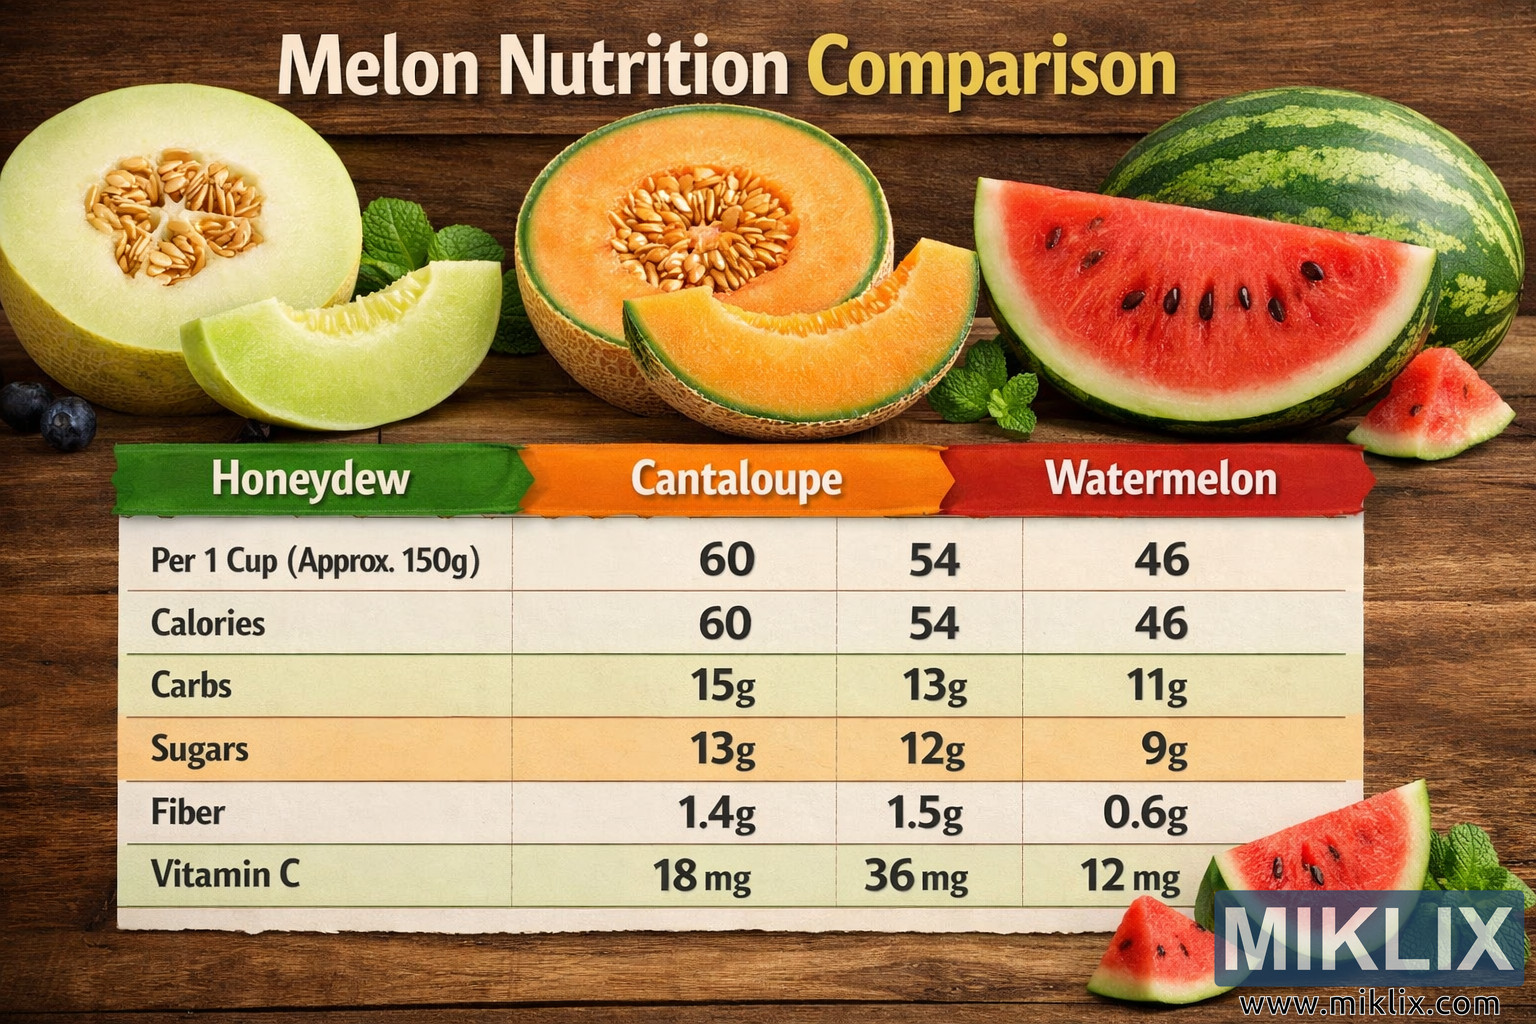
A detailed melon nutrition comparison infographic showing honeydew, cantaloupe, and watermelon side by side with a clear table of calories, carbs, sugars, sugars, fiber, and vitamin C per one cup serving, supported by vibrant fruit photography on a rustic wooden background.
Melon Nutrition Comparison Infographic
Các phiên bản có sẵn của hình ảnh này
Các tệp hình ảnh có sẵn để tải xuống bên dưới được nén ít hơn và có độ phân giải cao hơn - và do đó, chất lượng cao hơn - so với các hình ảnh được nhúng trong các bài viết và trang trên trang web này, vốn được tối ưu hóa về kích thước tệp để giảm mức tiêu thụ băng thông.
Kích thước thông thường (1,536 x 1,024)
Kích thước lớn (3,072 x 2,048)
Kích thước rất lớn (4,608 x 3,072)
Kích thước cực lớn (6,144 x 4,096)
Kích thước lớn đến mức buồn cười (1,048,576 x 699,051)
- Vẫn đang tải lên... ;-)
Mô tả hình ảnh
The image is a carefully designed landscape-oriented infographic that visually compares the nutritional values of three popular melons: honeydew, cantaloupe, and watermelon. The overall aesthetic combines vivid fruit photography with clean, structured data presentation, set against a warm, rustic wooden background that gives the composition a natural, inviting feel.
At the very top of the image, centered horizontally, a bold title reads "Melon Nutrition Comparison" in large, eye-catching text. The words are rendered in a combination of white and yellow, standing out clearly against the darker tones of the wooden surface beneath them. This title immediately communicates the purpose of the graphic: to help viewers understand how these three melons compare nutritionally. Behind and around the title, there is a visually appealing arrangement of real melon slices. On the left side, a halved honeydew melon is displayed, showing its pale green flesh and a central cavity filled with seeds. In the middle, a halved cantaloupe is presented, with its rich orange flesh and seed-filled center. On the right, a large slice of watermelon is shown, featuring bright red flesh, scattered black seeds, and a thick green rind. A small bunch of fresh mint leaves is placed near the watermelon, adding a touch of green and freshness to the composition.
Below the title and the top fruit arrangement, the infographic transitions into a structured comparison layout. Three vertical columns are aligned side by side, each dedicated to one type of melon. At the top of each column, a colored banner labels the melon variety. The left column has a green banner labeled "Honeydew," the middle column has an orange banner labeled "Cantaloupe," and the right column has a red banner labeled "Watermelon." These color choices echo the natural hues of the fruits themselves—green for honeydew, orange for cantaloupe, and red for watermelon—making it easy for viewers to associate each column with the corresponding melon at a glance.
Directly beneath each banner, there is a small, stylized image of a slice of the respective melon. Under the honeydew banner, a neat wedge of honeydew with pale green flesh is shown. Under the cantaloupe banner, an orange slice of cantaloupe appears, highlighting its vibrant color. Under the watermelon banner, a red slice of watermelon is depicted, complete with its characteristic seeds and rind. These smaller slices serve as visual icons that reinforce the identity of each column and help viewers quickly orient themselves within the comparison.
The core of the infographic is a table that spans the width of the three columns. This table is divided into six horizontal rows, each representing a different nutritional category. The first row provides context for the serving size, labeled "Per 1 Cup (Approx. 150g)." This row indicates that all the nutritional values listed below are based on a standardized one-cup serving of each melon, making the comparison fair and meaningful.
The second row is labeled "Calories" and shows the energy content for each melon. Under the honeydew column, the value "60" is displayed, indicating that one cup of honeydew contains 60 calories. Under the cantaloupe column, the value "54" appears, showing that one cup of cantaloupe has 54 calories. Under the watermelon column, the value "46" is listed, meaning that one cup of watermelon provides 46 calories. These numbers allow viewers to see at a glance that watermelon is the lowest in calories among the three, while honeydew is the highest, with cantaloupe falling in between.
The third row is labeled "Carbs" and presents the carbohydrate content per cup. In the honeydew column, the table shows "15g," indicating 15 grams of carbohydrates. In the cantaloupe column, the value "13g" is displayed, and in the watermelon column, the value "11g" appears. This row highlights that honeydew has the highest carbohydrate content, followed by cantaloupe, with watermelon again being the lowest.
The fourth row is labeled "Sugars" and focuses on the natural sugar content of each melon. Under honeydew, the value "13g" is listed, showing that one cup contains 13 grams of sugar. Under cantaloupe, the value "12g" is displayed, and under watermelon, the value "9g" appears. This row reinforces the pattern seen in the carbohydrate row: honeydew has the highest sugar content, cantaloupe is slightly lower, and watermelon has the least sugar per cup.
The fifth row is labeled "Fiber" and shows the dietary fiber content. In the honeydew column, the value "1.4g" is presented, indicating 1.4 grams of fiber per cup. In the cantaloupe column, the value "1.5g" appears, showing that cantaloupe has a slightly higher fiber content than honeydew. In the watermelon column, the value "0.6g" is listed, indicating that watermelon has the lowest fiber content among the three. This row helps viewers understand that while all three melons provide some fiber, cantaloupe offers a modest edge in this category.
The sixth and final row is labeled "Vitamin C" and highlights the vitamin C content in milligrams. Under honeydew, the value "18 mg" is displayed, indicating that one cup of honeydew provides 18 milligrams of vitamin C. Under cantaloupe, the value "36 mg" appears, showing that cantaloupe is particularly rich in vitamin C, offering 36 milligrams per cup. Under watermelon, the value "12 mg" is listed, indicating that watermelon provides 12 milligrams of vitamin C per cup. This row makes it clear that cantaloupe is the standout source of vitamin C among the three melons, with honeydew and watermelon offering smaller but still meaningful amounts.
Beneath the table, the infographic returns to a more photographic, illustrative style, showcasing larger images of the melons themselves. On the left side, a halved honeydew melon is displayed prominently, its pale green flesh and seed cavity clearly visible. Nearby, a small cluster of blueberries is placed, adding a contrasting deep blue color and suggesting a broader context of fruit variety, though the focus remains on the melons. In the center, a halved cantaloupe is shown alongside several cantaloupe slices, emphasizing the fruit’s rich orange color and slightly textured rind. On the right side, a large slice of watermelon is presented next to a smaller wedge, both showing the bright red flesh, scattered black seeds, and thick green rind that make watermelon visually distinctive. A sprig of mint is placed near the watermelon, echoing the mint leaves seen near the top of the image and reinforcing the fresh, summery feel of the composition.
The lighting throughout the image is even and well-balanced, ensuring that all text and fruit details are sharp and easy to see. The colors are vivid but not overly saturated, creating a realistic and appetizing appearance. The wooden background adds warmth and texture without distracting from the main content. The layout is carefully organized so that the viewer’s eye naturally moves from the title at the top, through the labeled columns and the detailed nutritional table, and finally down to the larger fruit images at the bottom.
Overall, the infographic successfully combines visual appeal with clear, accessible information. It allows viewers to quickly compare honeydew, cantaloupe, and watermelon across key nutritional metrics—calories, carbohydrates, sugars, fiber, and vitamin C—while also enjoying a vibrant, appetizing display of the fruits themselves. The use of color-coded banners, consistent typography, and realistic fruit photography makes the information easy to understand and remember, turning a simple nutritional comparison into an engaging visual experience.
Hình ảnh có liên quan đến: Honeydew Melon: The Refreshing Fruit Packed with Nutrients