
Image: Laboratory Analysis of Palisade Hops – Alpha Acids and Hop Oil Composition
Published: October 20, 2026 at 5:48:45 PM UTC
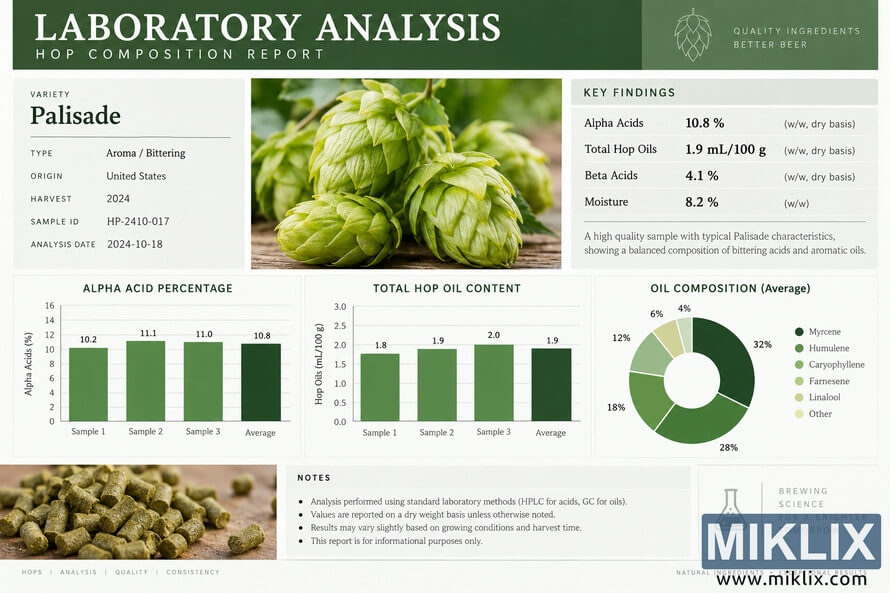
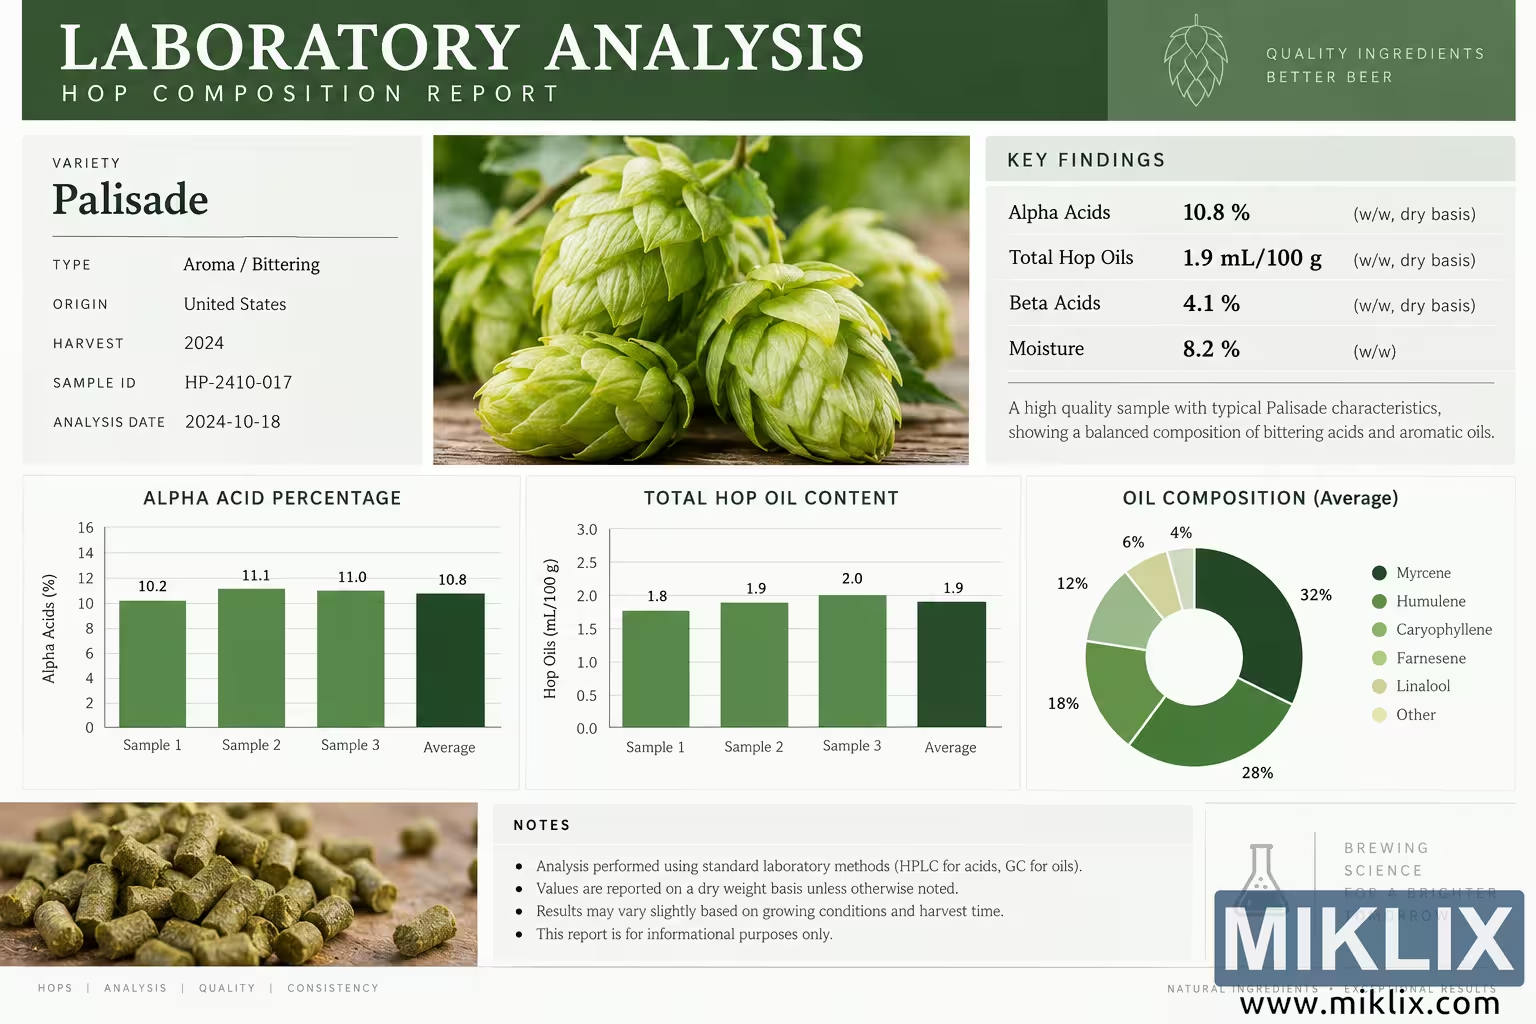
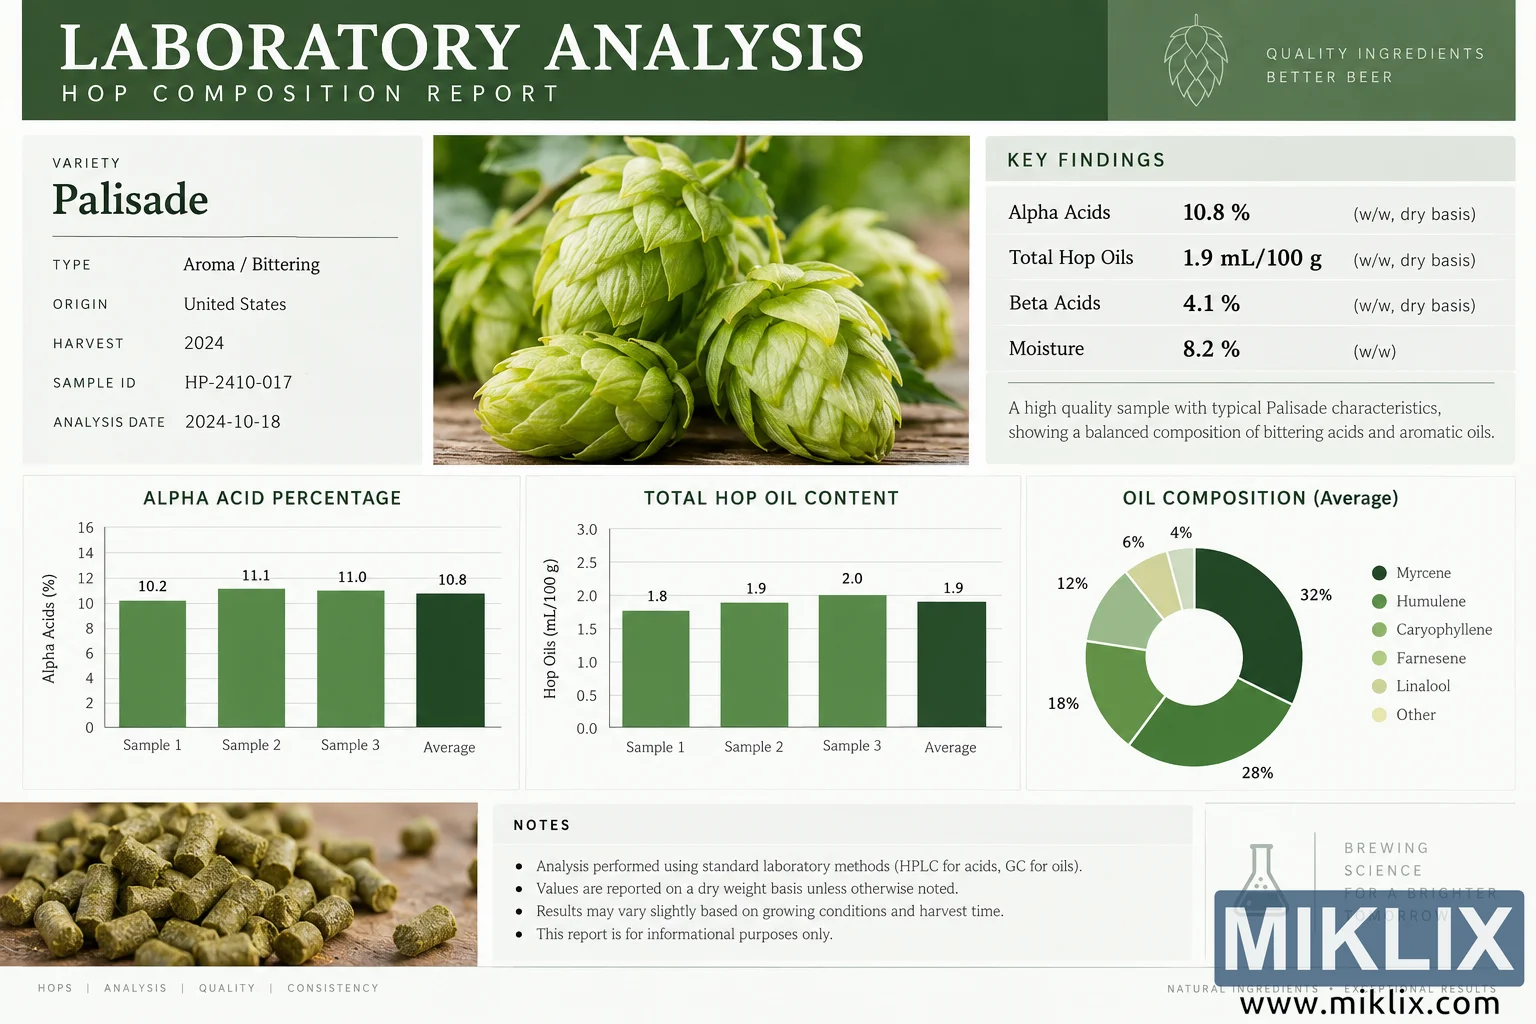
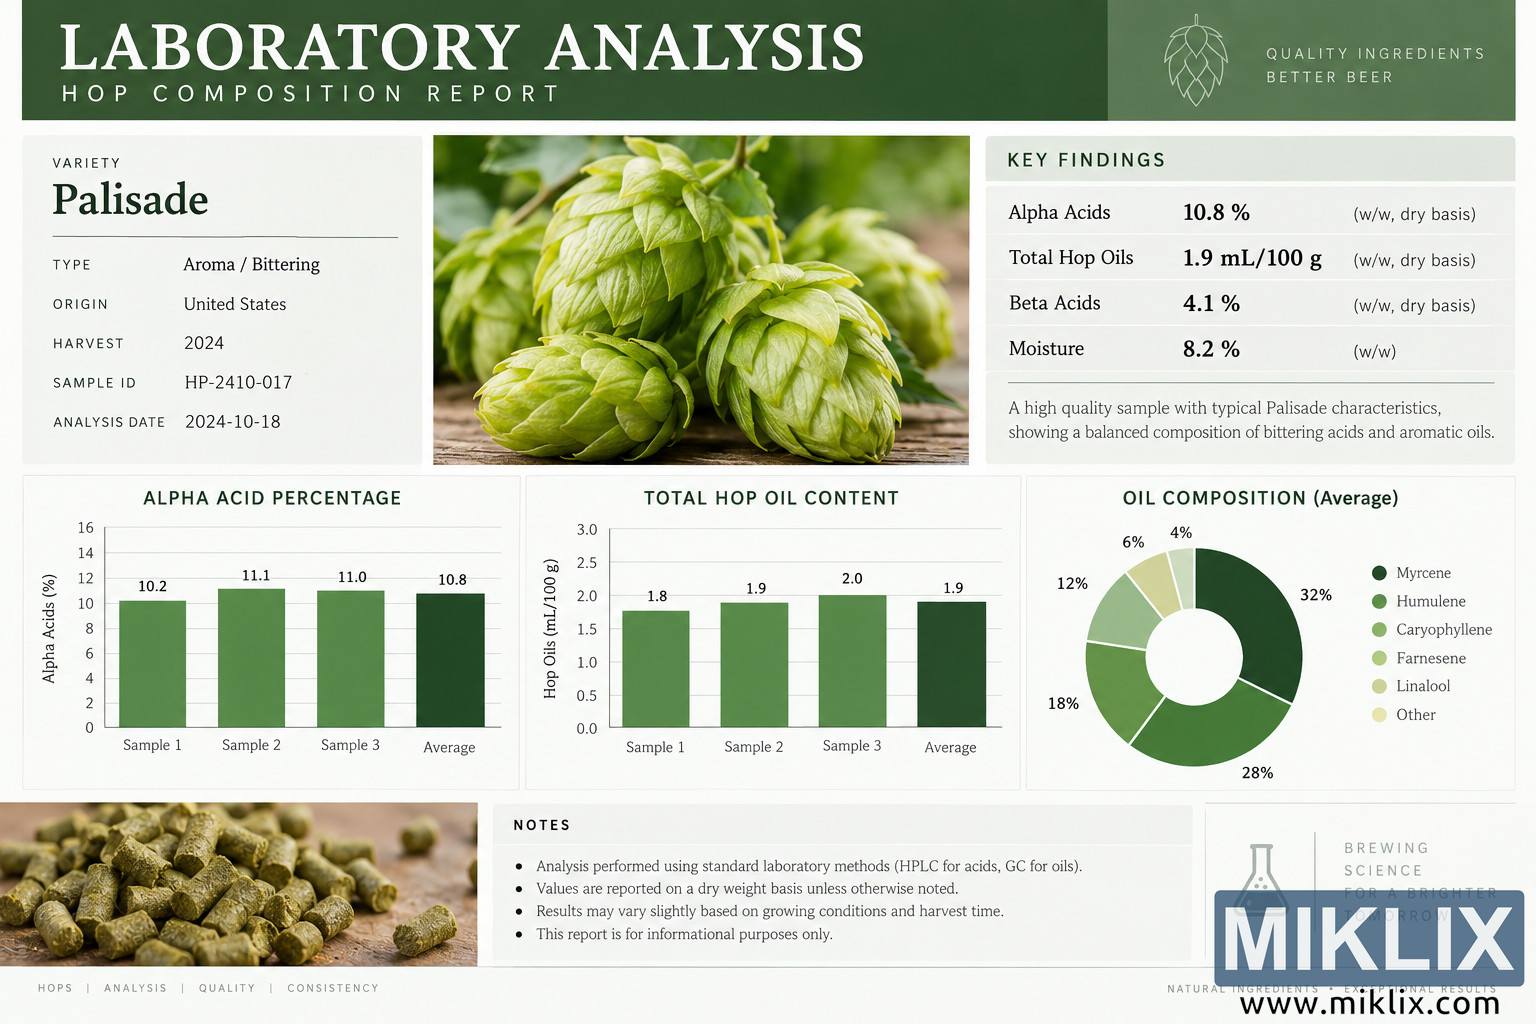
Laboratory-style Palisade hops analysis infographic showing alpha acids, total hop oil content, beta acids, moisture, sample comparisons, and average aromatic oil composition in a clean green scientific report design.
Available versions of this image
The image files available for download below are less compressed and higher resolution - and as a result of that, higher quality - than the images embedded in articles and pages on this website, which are more optimized for file size in order to reduce bandwidth consumption.
Regular size (1,536 x 1,024)
Large size (3,072 x 2,048)
Very large size (4,608 x 3,072)
Extra large size (6,144 x 4,096)
Comically large size (1,048,576 x 699,051)
- Still uploading... ;-)
Image description
A wide, landscape-format laboratory analysis infographic presents a detailed compositional report for Palisade hops. The design resembles a polished scientific or agricultural laboratory report, using a restrained palette of dark forest green, fresh hop green, cream, white, and pale gray. Across the top is a broad dark-green header containing the large white heading “LABORATORY ANALYSIS” and the smaller, widely spaced subtitle “HOP COMPOSITION REPORT.” On the right side of the header is a simple line-art hop cone symbol accompanied by the phrase “QUALITY INGREDIENTS BETTER BEER.” No actual commercial brand name or recognizable corporate logo appears in the image.
The upper portion of the report is divided into three main areas. At left is a sample-information panel headed “VARIETY,” with the name “Palisade” prominently displayed beneath it. The panel identifies the hop as an aroma and bittering type, gives its origin as the United States, lists a 2024 harvest, provides the sample identifier HP-2410-017, and displays an analysis date of 2024-10-18. The typography combines a traditional serif face for prominent data and a clean sans-serif style for small labels, giving the report a mixture of scientific formality and contemporary editorial design.
In the center of the upper section is a close-up photograph of several fresh green hop cones resting on a wooden surface. More hops and green foliage appear softly blurred in the background, producing a natural agricultural context while keeping the foreground cones sharply defined. The hop cones are pale to medium green with clearly visible overlapping bracts and subtle yellow-green highlights. Warm natural light emphasizes their texture and contrasts with the otherwise clinical report layout.
At upper right is a “KEY FINDINGS” panel. It reports Alpha Acids at 10.8%, Total Hop Oils at 1.9 mL/100 g, Beta Acids at 4.1%, and Moisture at 8.2%. The numerical results are set in bold type so they can be scanned quickly. Beneath the measurements is a short laboratory-style interpretation stating that the sample is high quality and shows typical Palisade characteristics, with a balanced composition of bittering acids and aromatic oils. Thin horizontal rules separate the findings and reinforce the structured scientific appearance.
The middle section contains three analytical charts. The first is a vertical bar chart titled “ALPHA ACID PERCENTAGE.” Its y-axis is labeled “Alpha Acids (%)” and displays four green bars. Sample 1 measures 10.2%, Sample 2 measures 11.1%, Sample 3 measures 11.0%, and the Average is 10.8%. The bars use related green tones, with the average presented in a darker green. Light horizontal grid lines make the values easy to compare while preserving a clean laboratory-report aesthetic.
The second chart is titled “TOTAL HOP OIL CONTENT.” It uses the same visual structure and plots hop oils in mL/100 g. Sample 1 is shown at 1.8 mL/100 g, Sample 2 at 1.9 mL/100 g, Sample 3 at 2.0 mL/100 g, and the Average at 1.9 mL/100 g. Again, the bars are green, the values appear immediately above them, and the average bar is visually emphasized with a deeper shade. Together, the first two charts provide an immediate visual comparison of laboratory measurements across three samples and their calculated averages.
The third visualization is a donut chart titled “OIL COMPOSITION (Average).” It divides the aromatic oil profile into several green and yellow-green segments. A legend identifies Myrcene, Humulene, Caryophyllene, Farnesene, Linalool, and Other. Percentages are positioned around the circular chart, including prominent values of 32%, 28%, 18%, 12%, 6%, and 4%. The dark-to-light sequence of greens visually differentiates the components while remaining consistent with the botanical theme of the report. The white center of the donut chart keeps the visualization uncluttered.
Along the lower left is another photographic element showing a pile of processed hop pellets on a light wooden surface. The pellets are cylindrical, olive green to brown-green, and vary slightly in size and texture. A few pieces are scattered away from the main pile. This photograph complements the image of fresh hop cones above by visually connecting raw agricultural hops with their processed brewing form.
The lower center contains a “NOTES” panel with four bullet points. The notes state that the analysis was performed using standard laboratory methods, referencing HPLC for acids and GC for oils; that values are reported on a dry-weight basis unless otherwise noted; that results may vary slightly according to growing conditions and harvest time; and that the report is intended for informational purposes. This section reinforces the impression of a technical laboratory document rather than a purely decorative brewing graphic.
At lower right is a minimalist line illustration of a laboratory flask beside the words “BREWING SCIENCE FOR A BRIGHTER TOMORROW.” A thin vertical line separates the flask from the text. The footer continues the understated scientific branding with small spaced words such as “HOPS,” “ANALYSIS,” “QUALITY,” and “CONSISTENCY” on the left, while the right side contains the phrase “NATURAL INGREDIENTS • EXCEPTIONAL RESULTS.” These elements are generic and do not identify a real-world company or commercial brand.
Overall, the image combines laboratory data visualization, botanical photography, processed hop imagery, and restrained editorial typography into a professional scientific infographic. The principal analytical focus is the alpha acid percentage and total oil content of Palisade hops, supplemented by beta acid, moisture, and aromatic oil composition information. The composition is organized into a precise rectangular grid with generous white space, subtle borders, and consistent alignment. Dark green headings and chart elements visually connect the scientific analysis to the natural green color of hops. The result resembles a high-resolution laboratory specification sheet or brewing-science quality report intended to communicate hop chemistry clearly and professionally.
The image is related to: Hops in Beer Brewing: Palisade