
Image: Laboratory Analysis of Alpha and Beta Acid Levels in Spalt Hops
Published: October 26, 2026 at 6:11:59 PM UTC
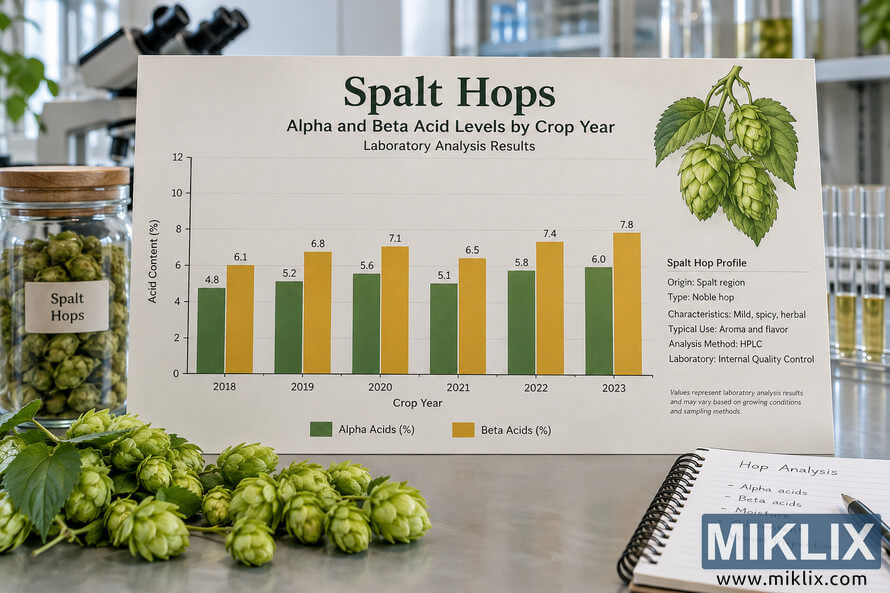
Laboratory-style image showing a scientific chart of alpha and beta acid levels in Spalt hops across multiple crop years, with hops, glassware, testing equipment, and brewing analysis details.
Available versions of this image
The image files available for download below are less compressed and higher resolution - and as a result of that, higher quality - than the images embedded in articles and pages on this website, which are more optimized for file size in order to reduce bandwidth consumption.
Regular size (1,536 x 1,024)
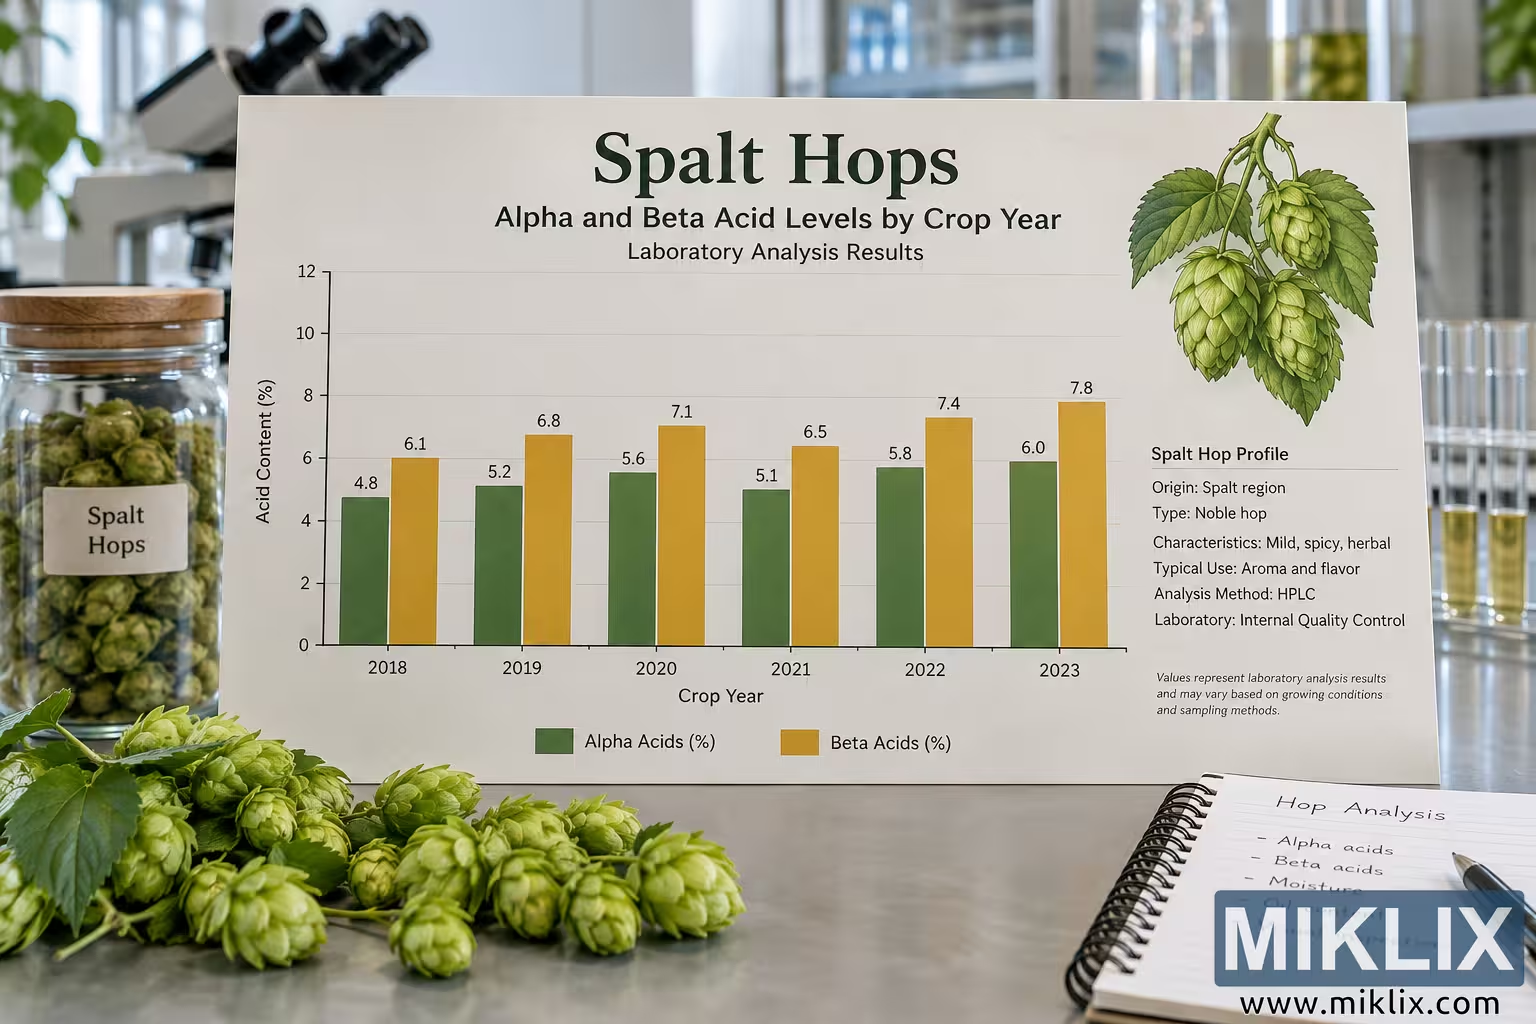
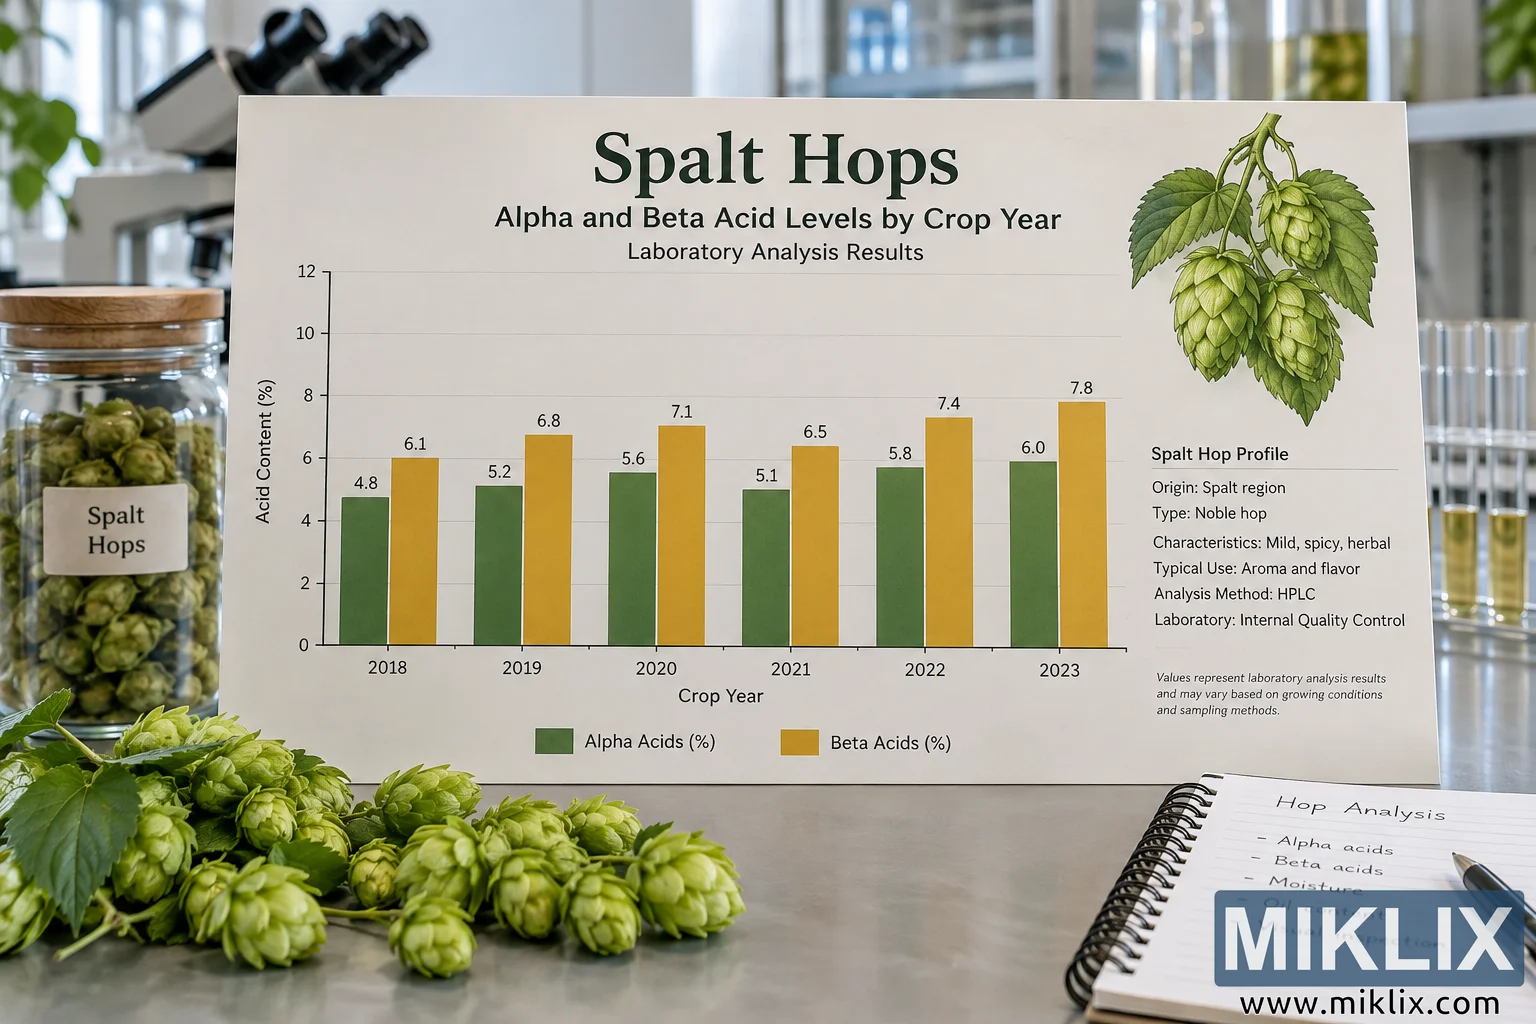
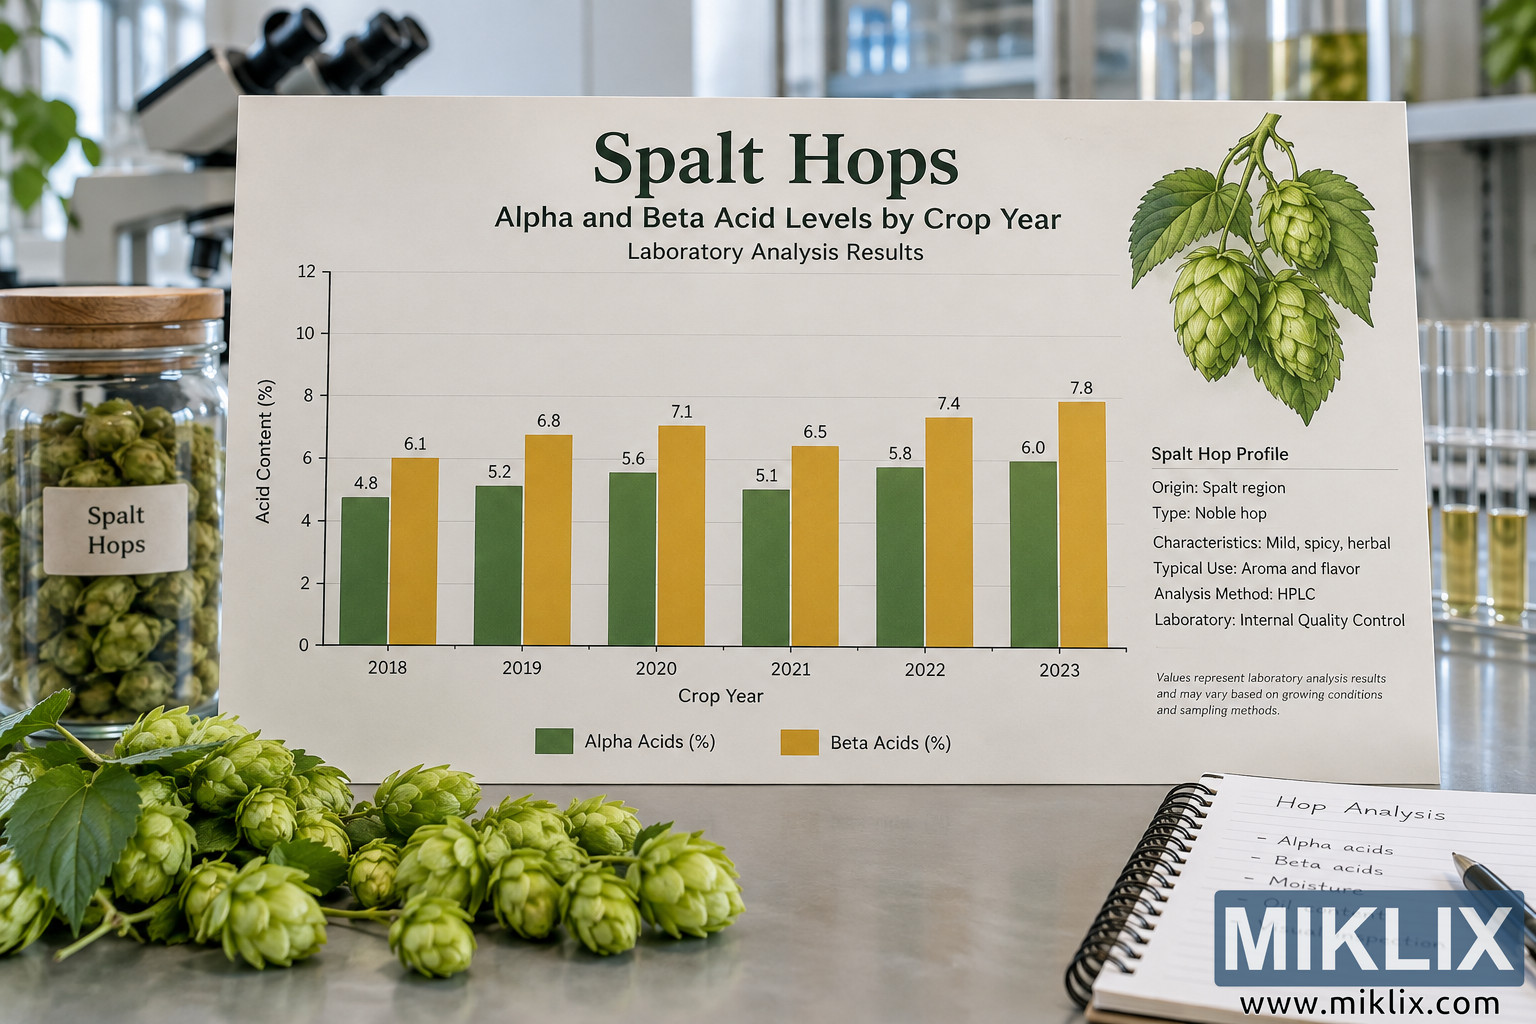
Large size (3,072 x 2,048)
Very large size (4,608 x 3,072)
Extra large size (6,144 x 4,096)
Comically large size (1,048,576 x 699,051)
- Still uploading... ;-)
Image description
A wide, landscape-oriented image presents a bright and realistic laboratory environment devoted to the analysis of Spalt hops. The central focus of the composition is a large, professionally printed laboratory analysis board positioned upright on a stainless-steel work surface. The board is headed with the prominent title “Spalt Hops,” followed by the subtitle “Alpha and Beta Acid Levels by Crop Year” and the smaller line “Laboratory Analysis Results.” Its restrained typography, structured layout, subtle grid lines, and scientific presentation give the image the appearance of a brewing laboratory, agricultural research facility, or hop quality-control laboratory.
The largest section of the board contains a grouped bar chart comparing alpha acid and beta acid content across six crop years, ranging from 2018 through 2023. The vertical axis is labeled “Acid Content (%)” and extends upward from zero, while the horizontal axis is labeled “Crop Year.” Each crop year contains two adjacent bars. Muted green bars represent alpha acids, while warm golden-yellow bars represent beta acids. A legend positioned beneath the chart identifies the two measurements as “Alpha Acids (%)” and “Beta Acids (%).” Numerical values are printed above the individual bars, making the chart resemble a detailed analytical report rather than a purely decorative graphic.
For 2018, the green alpha-acid bar is labeled 4.8 and the golden beta-acid bar is labeled 6.1. The 2019 crop year shows values of 5.2 for alpha acids and 6.8 for beta acids. In 2020, the values rise to 5.6 and 7.1 respectively. The chart then shows a modest decline for the 2021 crop, with alpha acids at 5.1 and beta acids at 6.5. The values increase again in 2022, reaching 5.8 for alpha acids and 7.4 for beta acids. Finally, the 2023 crop year displays the highest pair of values on the chart, with alpha acids at 6.0 and beta acids at 7.8. Across all six illustrated years, the golden beta-acid bars are taller than the corresponding green alpha-acid bars, creating a visually consistent distinction between the two measured components. These figures function as illustrative laboratory-chart data within the generated scene rather than verified historical measurements.
On the right side of the analysis board is a detailed botanical illustration of a hop plant. Several pale green hop cones hang from a stem surrounded by serrated green leaves. The botanical artwork introduces a traditional scientific-reference quality while clearly connecting the analytical chart to the agricultural ingredient being studied. Directly beneath this illustration is a section titled “Spalt Hop Profile.” It describes the origin as the Spalt region, identifies the type as a noble hop, characterizes it as mild, spicy, and herbal, and notes a typical use associated with aroma and flavor. The profile also identifies HPLC as the analysis method and refers to internal laboratory quality control. Small text near the bottom explains that the displayed values represent laboratory analysis results and may vary according to growing conditions and sampling methods.
The laboratory setting surrounding the board reinforces the scientific theme. On the left side of the image, a transparent glass storage jar with a wooden lid is filled with dried green hop cones. A simple neutral label on the jar reads “Spalt Hops.” In front of the jar and extending across the lower-left foreground is a generous arrangement of fresh hop vines. Numerous green hop cones are clustered among broad leaves and stems, providing a natural, tactile contrast to the precise analytical chart. The foreground hops are rendered with visible overlapping bracts and subtle variations in green, suggesting freshly harvested plant material awaiting inspection or testing.
Behind the board, laboratory equipment is visible in soft focus. A binocular microscope occupies the upper-left background, immediately establishing the scientific setting without competing with the central chart. Shelving and laboratory containers appear farther back, softened by the shallow depth of field. On the right side, transparent test tubes and other pieces of glassware contain pale yellow or greenish liquids suggestive of prepared analytical samples or hop extracts. Tall glass vessels in the background add further visual context while remaining intentionally understated. There are no visible commercial logos or recognizable brand identities anywhere in the scene.
In the lower-right foreground, a spiral-bound notebook rests diagonally on the metal laboratory surface. The heading “Hop Analysis” is handwritten at the top of the page. Beneath it is a short checklist referring to alpha acids, beta acids, moisture, oil content, and visual inspection. A dark pen lies across the notebook, suggesting that a laboratory technician or quality-control specialist has been recording observations during an analysis session. The notebook, physical hop samples, glassware, and analytical display together create the impression of an active but carefully organized workspace.
The overall lighting is bright, clean, and natural, with soft daylight illuminating the laboratory and creating gentle reflections on the stainless-steel counter and glass vessels. The image uses a restrained palette dominated by botanical greens, warm golden yellows, neutral whites, metallic gray, and natural wood tones. The composition balances scientific precision with agricultural subject matter: the chart supplies structured quantitative information, while the fresh and dried hop cones emphasize the physical crop behind the measurements. The result is a polished laboratory-themed visualization of alpha and beta acid analysis in Spalt hops across multiple crop years, presented as a realistic photographic scene with an integrated scientific infographic.
The image is related to: Hops in Beer Brewing: Spalt