
Image: Scientific Visualization of Kölsch Ale Yeast Pitching Rates
Published: May 14, 2026 at 4:29:41 PM UTC
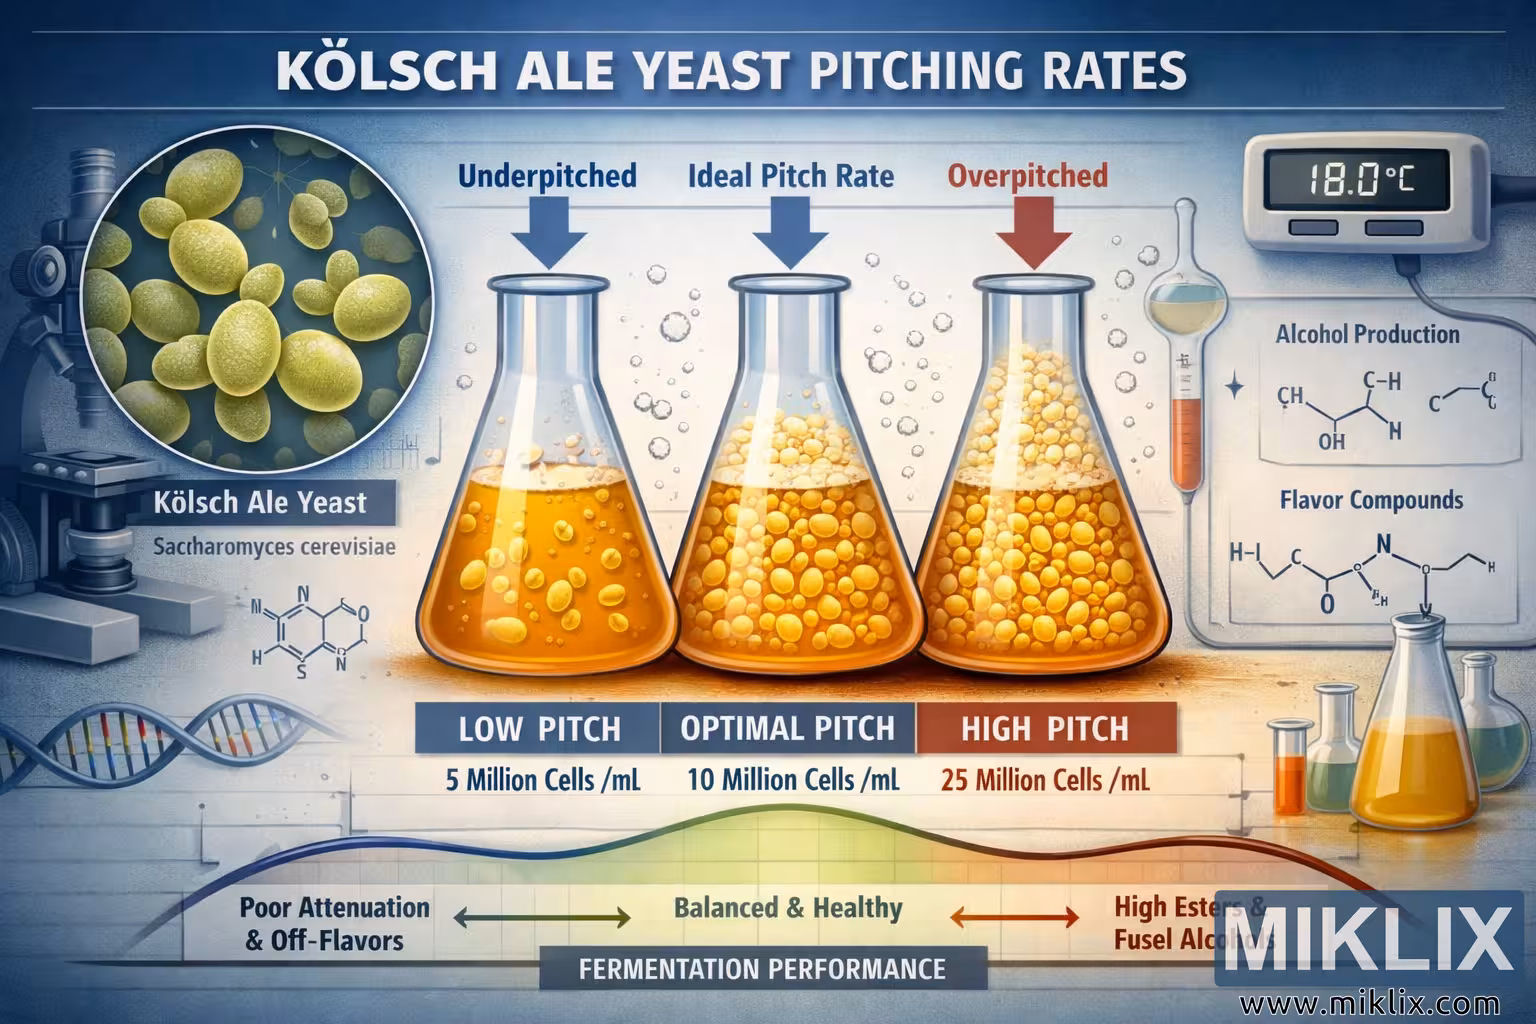
Scientific illustration explaining Kölsch ale yeast pitching rates in fermentation, showing low, optimal, and high pitch conditions with yeast density, fermentation performance, and temperature details.

Available versions of this image
The image files available for download below are less compressed and higher resolution - and as a result of that, higher quality - than the images embedded in articles and pages on this website, which are more optimized for file size in order to reduce bandwidth consumption.
Regular size (1,536 x 1,024)
Large size (3,072 x 2,048)
Very large size (4,608 x 3,072)
Extra large size (6,144 x 4,096)
Comically large size (1,048,576 x 699,051)
- Still uploading... ;-)
Image description
This scientifically styled digital illustration presents a detailed visual explanation of pitching rates in fermentation, focusing on Kölsch ale yeast. The composition resembles a professional brewing science infographic, with a blue gradient background that evokes a laboratory setting. At the top, the title “KÖLSCH ALE YEAST PITCHING RATES” appears in bold, capitalized letters, establishing the theme. On the left, a circular inset shows magnified Kölsch ale yeast cells labeled “Saccharomyces cerevisiae.” The cells are oval, light green, and budding, surrounded by a DNA helix, chemical diagrams, and a microscope motif, symbolizing microbiological analysis.
The central section features three Erlenmeyer flasks filled with golden wort, each representing a different pitching rate: “LOW PITCH” (5 Million Cells/mL), “OPTIMAL PITCH” (10 Million Cells/mL), and “HIGH PITCH” (25 Million Cells/mL). Arrows above the flasks are labeled “Underpitched,” “Ideal Pitch Rate,” and “Overpitched.” The yeast density increases from left to right, visually illustrating how cell concentration affects fermentation. Bubbles rise from the yeast in each flask, indicating active fermentation. The left flask shows sparse yeast and fewer bubbles, the middle flask balanced activity, and the right flask dense yeast and vigorous bubbling.
Below the flasks, a horizontal graph titled “FERMENTATION PERFORMANCE” spans the width of the image. It transitions from “Slow & Stressed” on the left to “Balanced & Healthy” in the center and “Fast & Excessive” on the right. A curved line traces this progression, showing how fermentation quality changes with pitching rate. Supporting text explains the outcomes: “Poor Attenuation & Off-Flavors” for underpitching, “Clean Fermentation” for optimal pitching, and “High Esters & Fusel Alcohols” for overpitching. This section visually connects yeast quantity to flavor and fermentation behavior.
On the right side, laboratory details reinforce the scientific context. A digital thermometer reads “18.0°C (65°F),” representing a typical Kölsch fermentation temperature. Nearby, schematic diagrams labeled “Alcohol Production” and “Flavor Compounds” display simplified molecular structures of ethanol, esters, and fusel alcohols. These diagrams link yeast activity to chemical results, illustrating how pitching rate influences flavor compound formation.
The color palette combines cool blues and teals with warm golden tones, balancing scientific precision with brewing warmth. The layout is symmetrical and methodical, guiding the viewer’s eye from the yeast inset to the flasks, then to the performance graph and chemical diagrams. The image effectively communicates how pitching rate impacts yeast health, fermentation speed, and flavor profile in Kölsch-style ales. It integrates microbiological imagery, quantitative data, and brewing outcomes into a cohesive educational visual. The scientific motifs—DNA, molecular structures, and temperature readings—underscore the analytical nature of brewing science, while the golden wort and bubbles evoke the craft and vitality of fermentation.
Overall, this illustration serves as both an educational and aesthetic representation of yeast pitching rates. It demonstrates how underpitching leads to sluggish fermentation and off-flavors, optimal pitching yields clean and balanced results, and overpitching accelerates fermentation but risks excessive ester and alcohol production. The image bridges biology and brewing, showing the delicate balance between yeast quantity and beer quality. Its clarity, symmetry, and scientific detail make it suitable for use in brewing education, presentations, or technical documentation, offering a visually engaging summary of Kölsch ale yeast fermentation dynamics.
The image is related to: Fermenting Beer with White Labs WLP029 Kölsch Ale Yeast