
画像: Nutritional Comparison of Persimmons With Other Common Fruits
出版された:
最終更新日 2026年6月4日 18:32:43 UTC
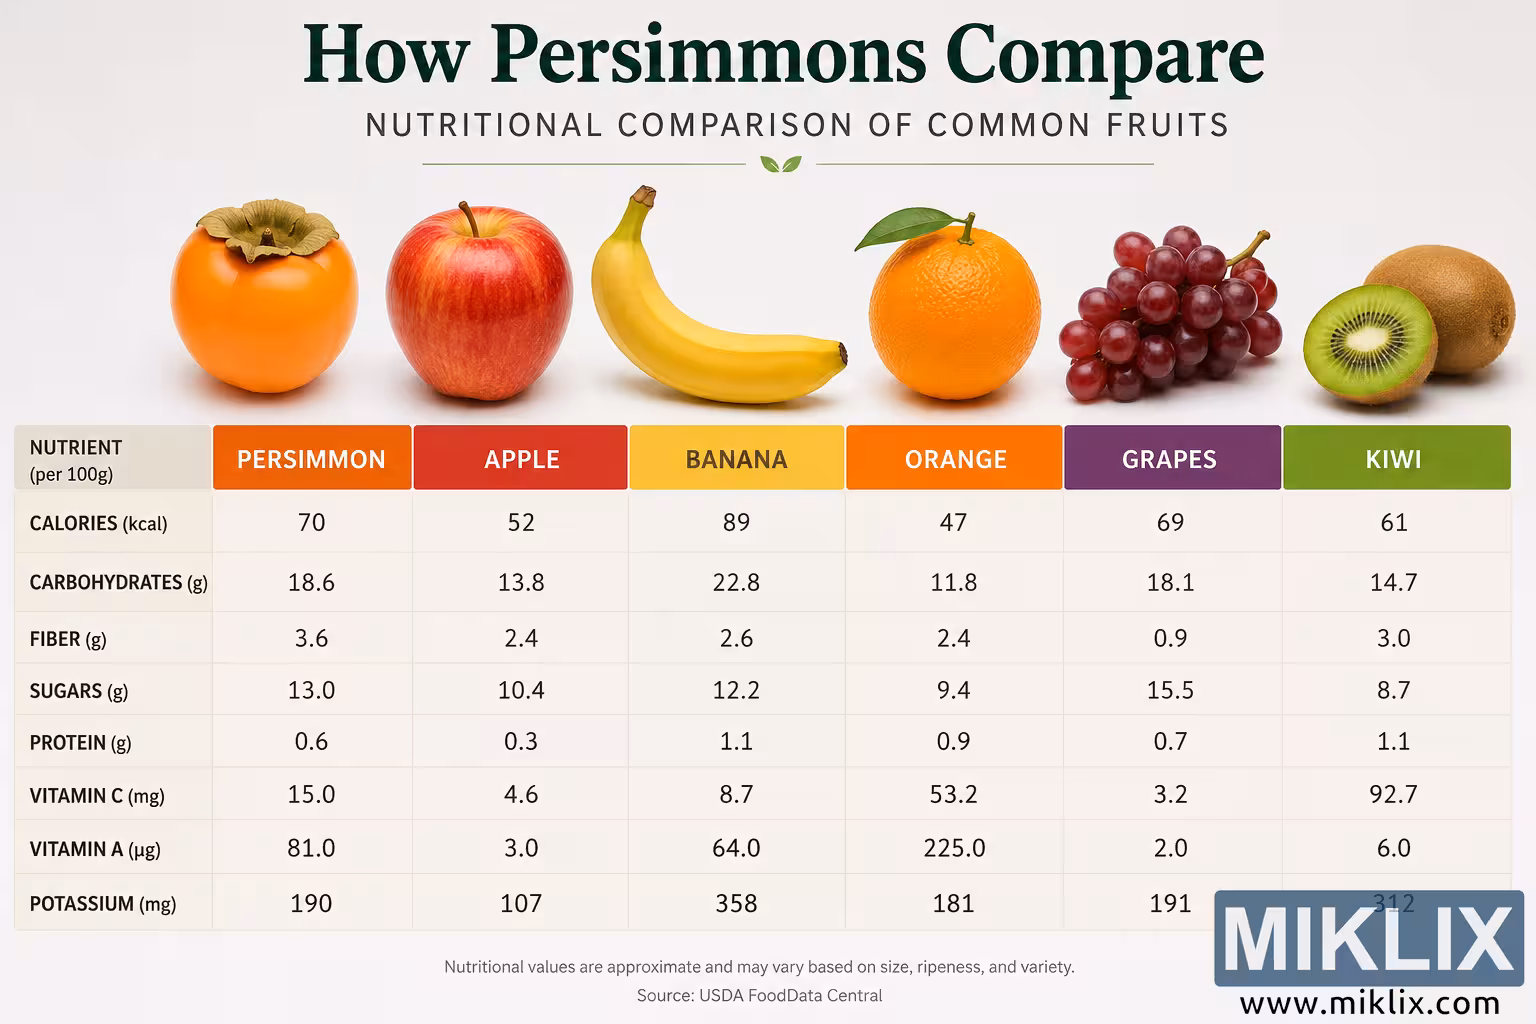
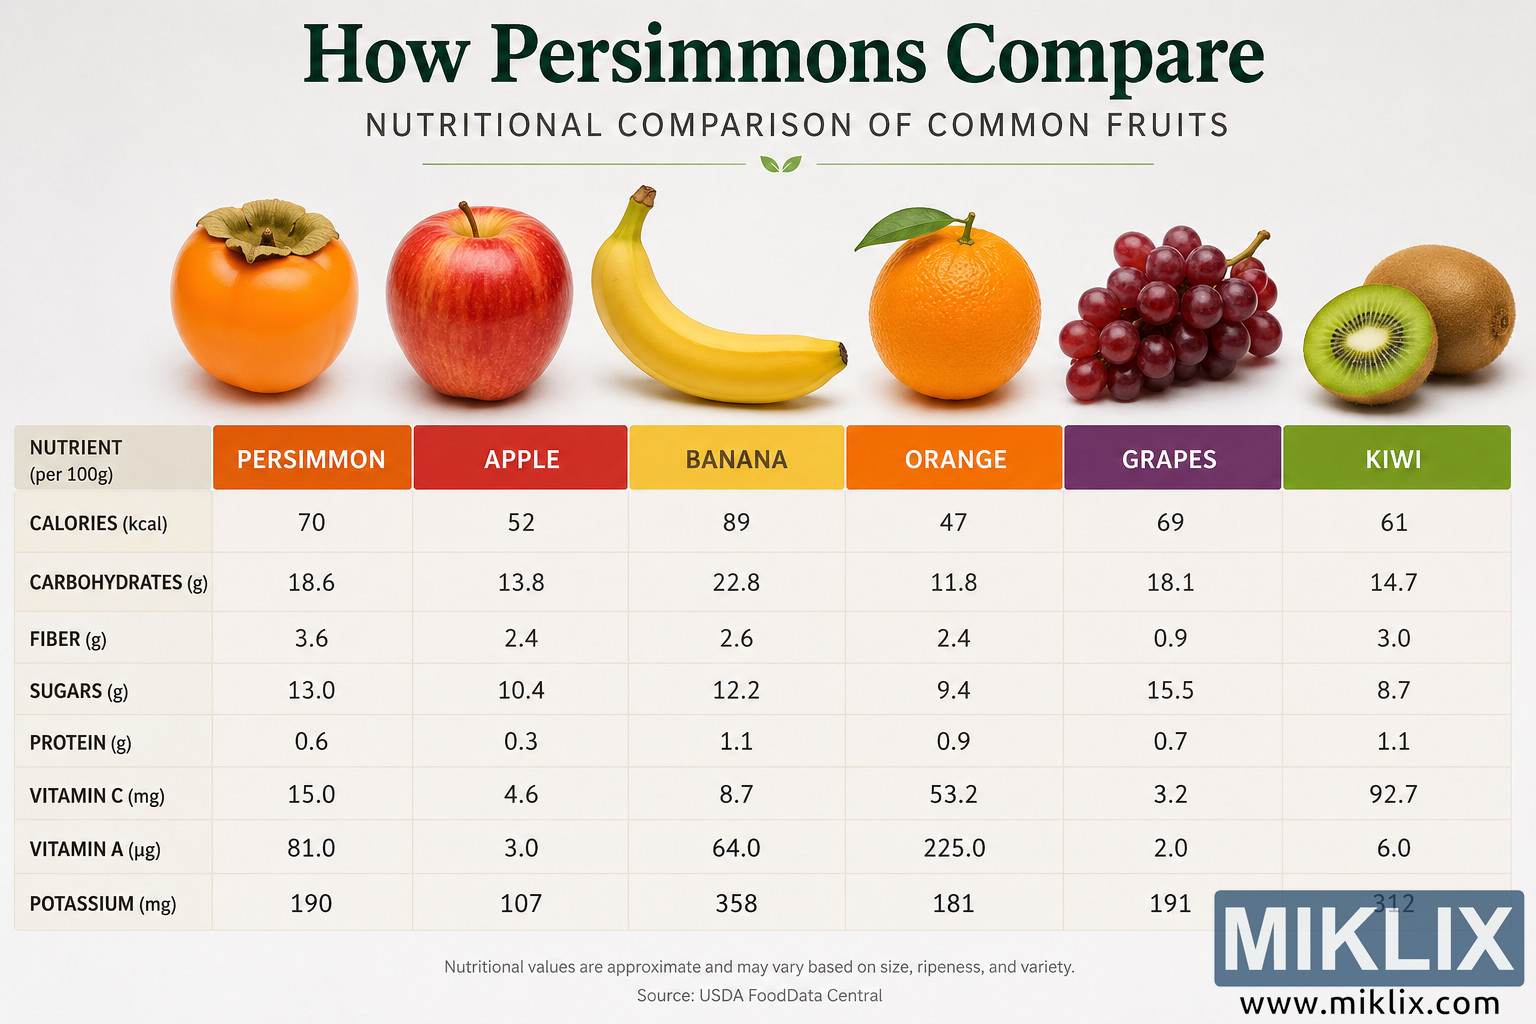
High-resolution infographic showing a nutritional comparison between persimmons and other common fruits including apples, bananas, oranges, grapes, and kiwis. Includes nutrient values per 100 grams with a clean, modern layout.
Nutritional Comparison of Persimmons With Other Common Fruits

この画像の利用可能なバージョン
以下のダウンロード可能な画像ファイルは、帯域幅の消費を抑えるためにファイルサイズが最適化されている当ウェブサイトの記事やページに埋め込まれている画像よりも、圧縮率が低く、解像度が高く、その結果、品質が高くなっています。
レギュラーサイズ (1,536 x 1,024)
大きいサイズ (3,072 x 2,048)
非常に大きなサイズ (4,608 x 3,072)
特大サイズ (6,144 x 4,096)
非常に大きなサイズ (1,048,576 x 699,051)
- まだアップロード中だ。)
画像説明
This high-resolution landscape infographic presents a detailed nutritional comparison between persimmons and several other commonly consumed fruits. The overall design is clean, modern, and educational, using a light neutral background that emphasizes both the colorful fruit imagery and the structured nutrition table beneath it. At the top center of the image, a large dark green title reads “How Persimmons Compare,” with a smaller subtitle directly below stating “Nutritional Comparison of Common Fruits.” Thin decorative green divider lines and a small leaf icon add a natural and health-focused visual theme.
Below the title area, six realistic fruit illustrations are evenly spaced horizontally across the width of the image. From left to right, the fruits shown are a bright orange persimmon with a green leafy calyx, a red-and-yellow apple, a curved yellow banana, a vibrant orange with a green leaf attached, a cluster of red-purple grapes, and a sliced kiwi displayed beside a whole kiwi fruit. Each fruit is rendered with realistic lighting, soft shadows, and vivid natural color, giving the infographic a polished and professional appearance.
The lower two-thirds of the image contains a large comparison table with clearly separated columns and rows. The table compares the nutritional values of the six fruits using standardized serving information per 100 grams. The leftmost column lists nutrient categories, while each subsequent column is dedicated to one fruit. Colored header bars distinguish the fruits visually: persimmon uses a deep orange shade, apple uses red, banana uses yellow, orange uses orange, grapes use purple, and kiwi uses green. The nutrient label column on the far left uses a neutral beige tone.
The table contains eight nutritional categories. The first row compares calories in kilocalories. Persimmon contains 70 calories, apple contains 52, banana contains 89, orange contains 47, grapes contain 69, and kiwi contains 61. The second row compares carbohydrates in grams, showing persimmon at 18.6 grams, apple at 13.8 grams, banana at 22.8 grams, orange at 11.8 grams, grapes at 18.1 grams, and kiwi at 14.7 grams.
The third row compares dietary fiber content. Persimmon contains 3.6 grams of fiber, which is higher than apple at 2.4 grams, banana at 2.6 grams, orange at 2.4 grams, grapes at 0.9 grams, and kiwi at 3.0 grams. The fourth row compares sugars, with grapes showing the highest value at 15.5 grams, followed by persimmon at 13.0 grams, banana at 12.2 grams, apple at 10.4 grams, orange at 9.4 grams, and kiwi at 8.7 grams.
The fifth row compares protein content. Banana and kiwi both contain 1.1 grams of protein, orange contains 0.9 grams, grapes contain 0.7 grams, persimmon contains 0.6 grams, and apple contains 0.3 grams. The sixth row compares vitamin C content measured in milligrams. Kiwi contains the highest amount at 92.7 milligrams, followed by orange at 53.2 milligrams. Persimmon contains 15.0 milligrams, banana contains 8.7 milligrams, apple contains 4.6 milligrams, and grapes contain 3.2 milligrams.
The seventh row compares vitamin A content measured in micrograms. Orange shows the highest value at 225.0 micrograms, persimmon contains 81.0 micrograms, banana contains 64.0 micrograms, kiwi contains 6.0 micrograms, apple contains 3.0 micrograms, and grapes contain 2.0 micrograms. The eighth and final row compares potassium content in milligrams. Banana contains the highest amount at 358 milligrams, kiwi contains 312 milligrams, grapes contain 191 milligrams, persimmon contains 190 milligrams, orange contains 181 milligrams, and apple contains 107 milligrams.
At the bottom center of the infographic, a small disclaimer notes that nutritional values are approximate and may vary based on size, ripeness, and variety. Beneath this disclaimer, the source attribution references USDA FoodData Central. The typography throughout the infographic is highly legible and professionally aligned, using large headings and consistent spacing to support readability. The overall visual presentation is balanced and informative, designed for educational, nutritional, and health-related content usage across websites, presentations, blogs, and social media platforms.
画像は関連するものです: The Complete Guide to the Health Benefits of Persimmons