
Image: Kruskal’s Maze Generation Algorithm Explained
Published: January 10, 2026 at 8:19:26 PM UTC
Last updated: January 10, 2026 at 8:19:41 PM UTC
Educational infographic explaining Kruskal’s maze generation algorithm with clear steps from starting grid to finished maze.

Available versions of this image
The image files available for download below are less compressed and higher resolution - and as a result of that, higher quality - than the images embedded in articles and pages on this website, which are more optimized for file size in order to reduce bandwidth consumption.
Regular size (1,536 x 1,024)
Large size (3,072 x 2,048)
Very large size (4,608 x 3,072)
Extra large size (6,144 x 4,096)
Comically large size (1,048,576 x 699,051)
- Still uploading... ;-)
Image description
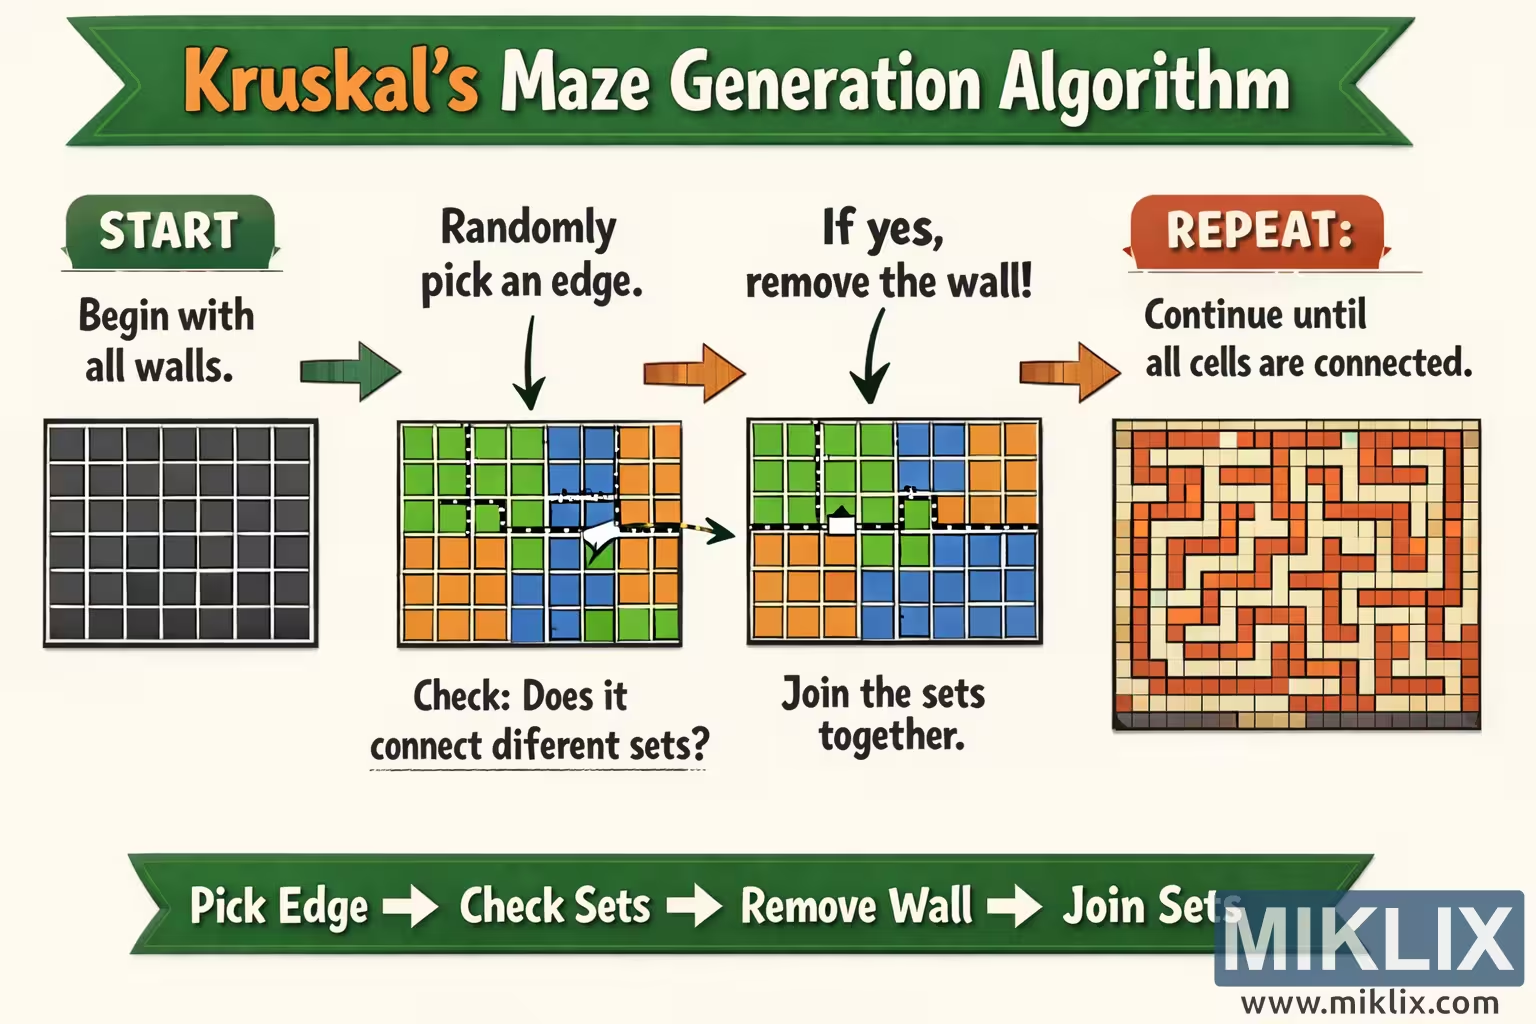
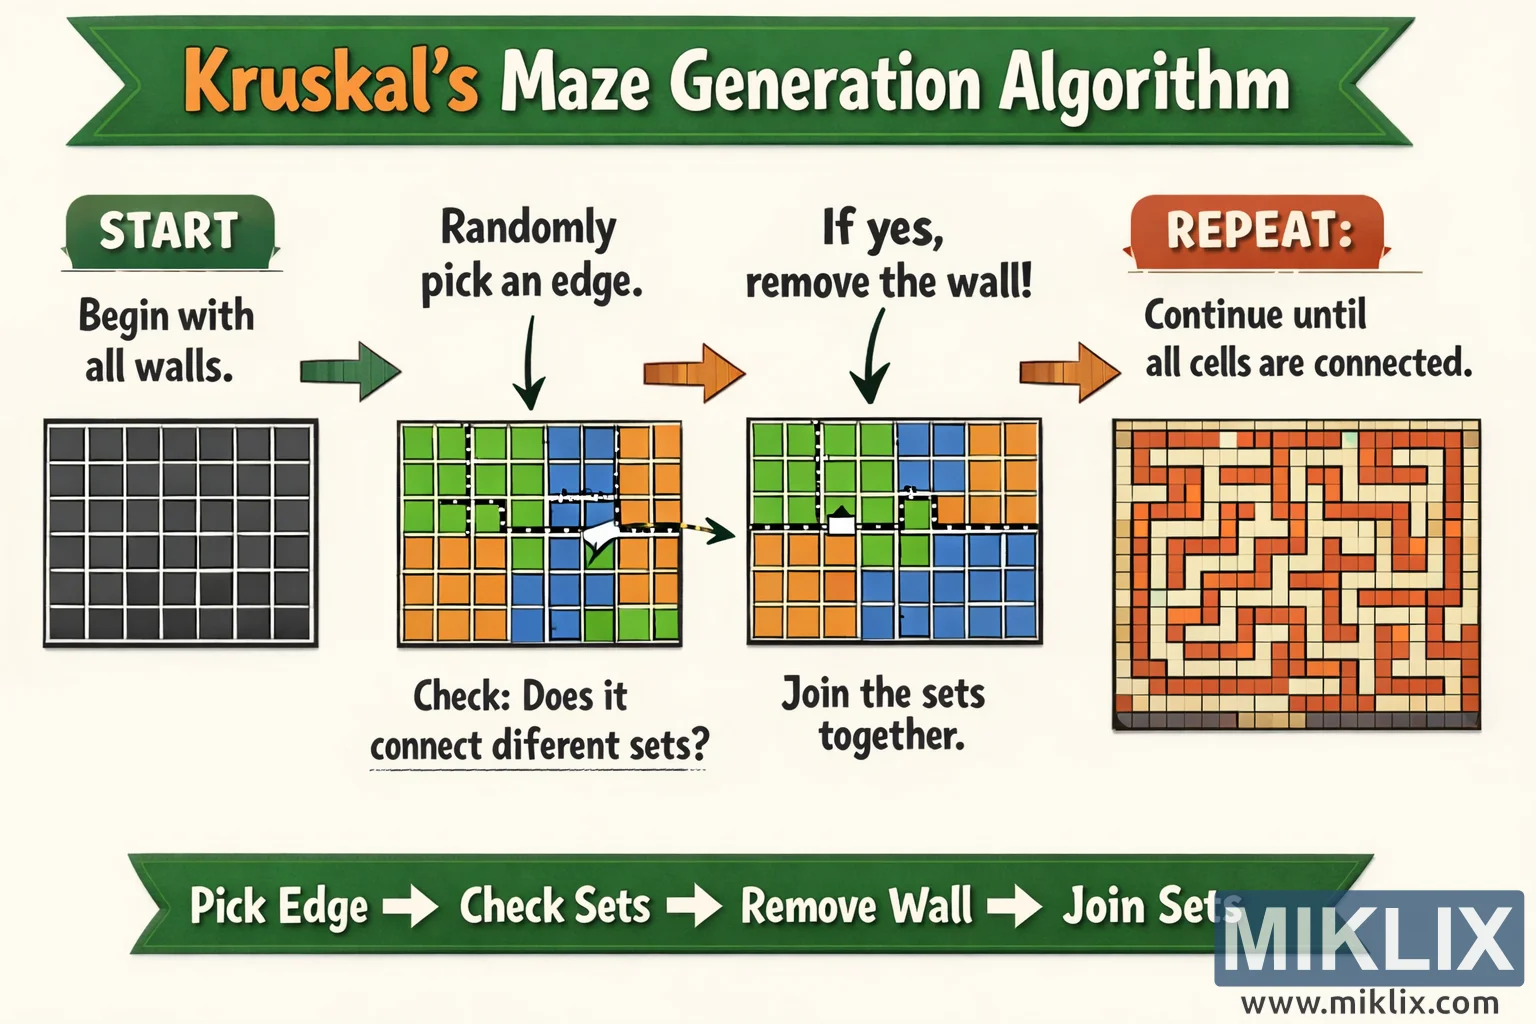
The image is a wide, landscape-oriented educational infographic explaining the idea of Kruskal’s maze generation algorithm in a friendly, visual way. Across the very top runs a long green ribbon banner with a bold headline reading “Kruskal’s Maze Generation Algorithm.” The layout is arranged from left to right, guiding the viewer through a sequence of simplified steps that together show how a maze gradually emerges from a fully walled grid.
On the far left is the first panel, labeled “START.” It shows a square grid filled with uniform dark tiles, representing a maze where every possible wall is still present and no passages have been carved. A large arrow points from this panel to the next one.
The second panel is labeled “Randomly pick an edge.” Here the grid is divided into colored regions—greens, blues, and oranges—to symbolize different sets of cells. Between two neighboring cells a dashed line and arrow highlight a chosen wall or edge, indicating that the algorithm is considering whether to remove it. Beneath this panel is a caption that asks, “Check: Does it connect different sets?” emphasizing the core idea without going into implementation details.
An arrow leads to the third panel, labeled “If yes, remove the wall!” This panel shows a similar colored grid, but the highlighted wall has been removed so that two colored regions are now connected. Underneath, a short caption reads “Join the sets together,” reinforcing that the two areas have merged into one connected group.
Another arrow leads to the fourth panel on the right, labeled “REPEAT.” This final panel shows a complete maze drawn in warm orange and cream tones. All cells are connected into one continuous labyrinth of corridors and walls. A caption beside it says, “Continue until all cells are connected,” summarizing the stopping condition in plain language.
At the very bottom of the infographic is another green ribbon banner acting as a process summary. It displays a concise flow: “Pick Edge → Check Sets → Remove Wall → Join Sets.” This footer visually reinforces the repeated cycle of steps that gradually transforms the fully walled grid into a finished maze.
Overall, the image uses large text, arrows, bright colors, and simple shapes to make the abstract idea of Kruskal’s algorithm approachable. It avoids low-level technicalities and instead focuses on the conceptual progression from isolated cells to a fully connected maze, making it suitable as a teaching visual for students or readers new to maze generation.
The image is related to: Kruskal's Algorithm Maze Generator