
Gambar: Collard Greens Calcium Content Comparison Chart
Diterbitkeun:
Panungtungan diropéa: 21 Juli 2026 jam 20.41.00 UTC
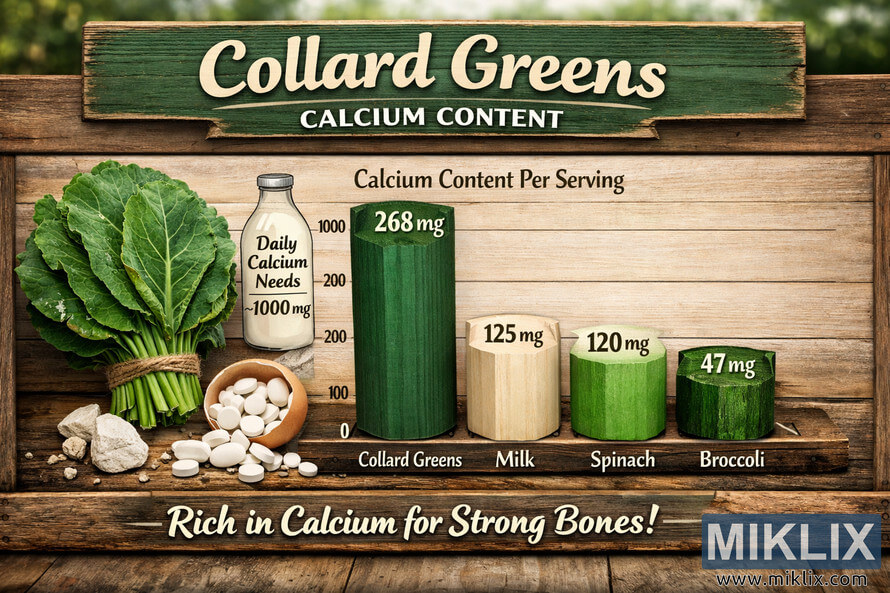
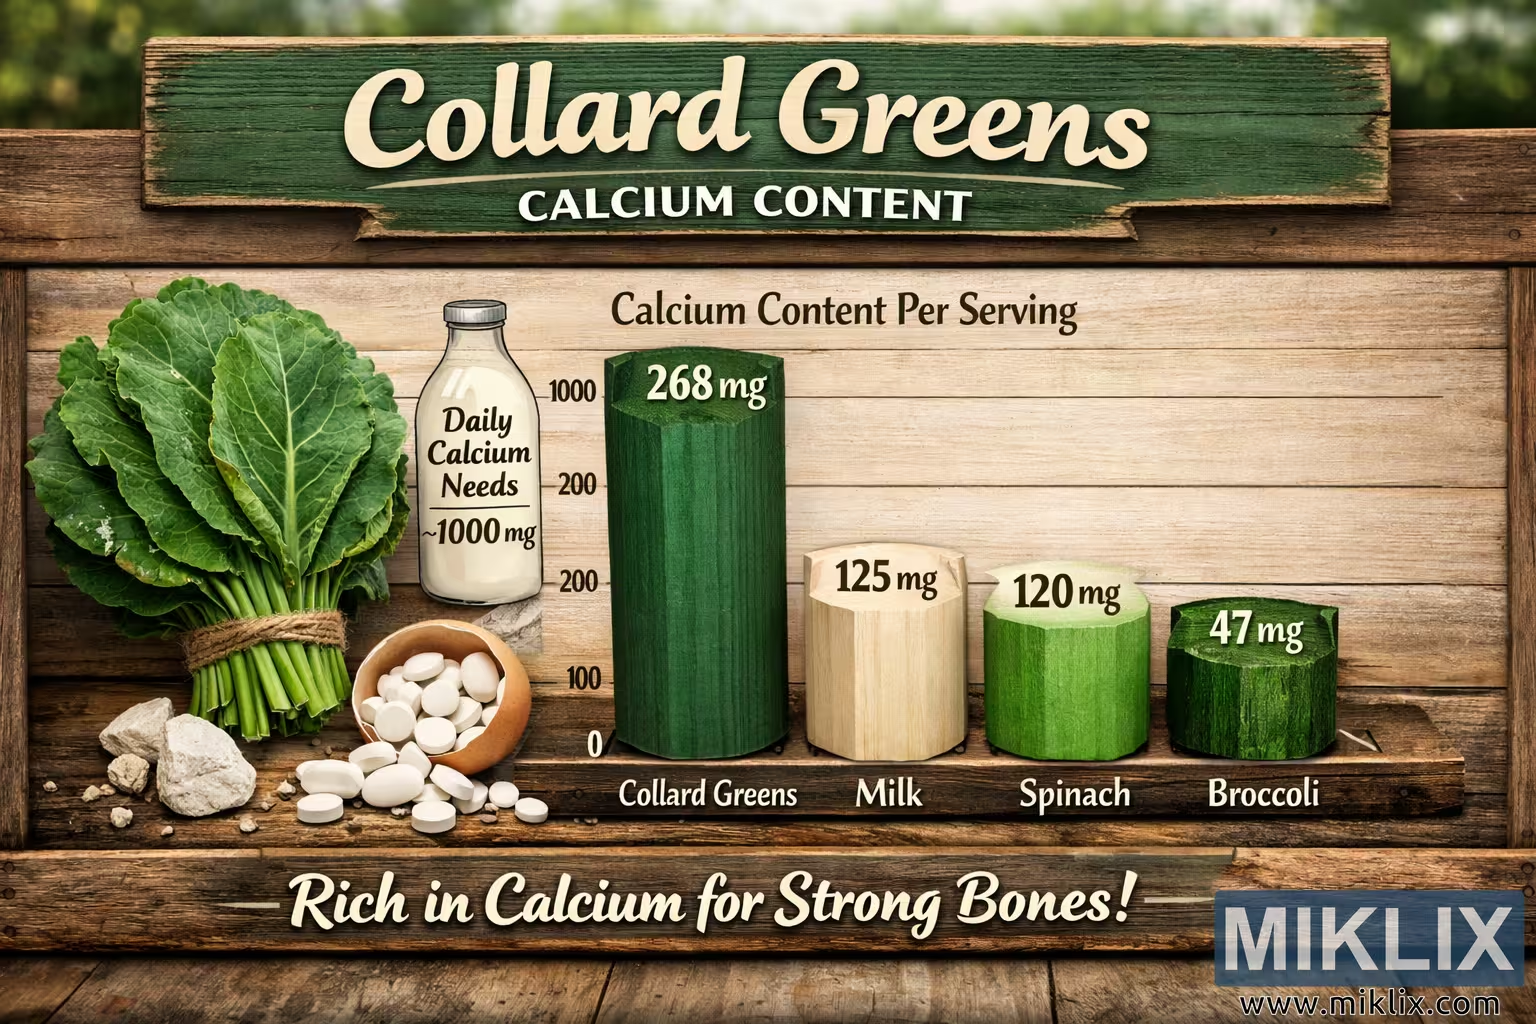
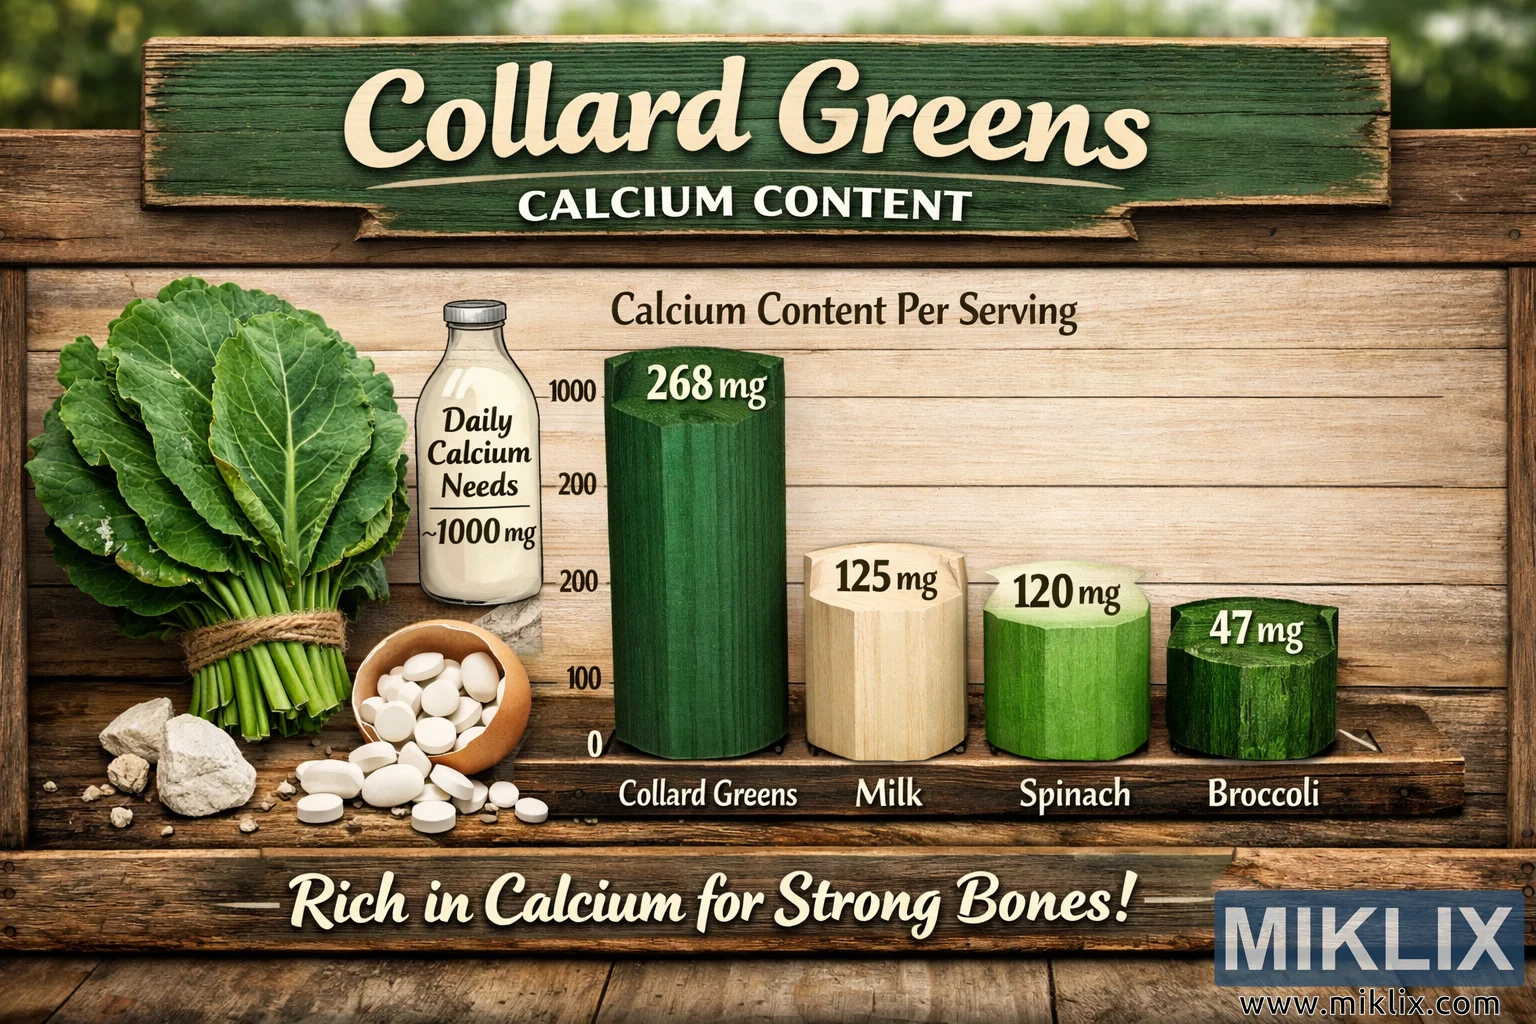
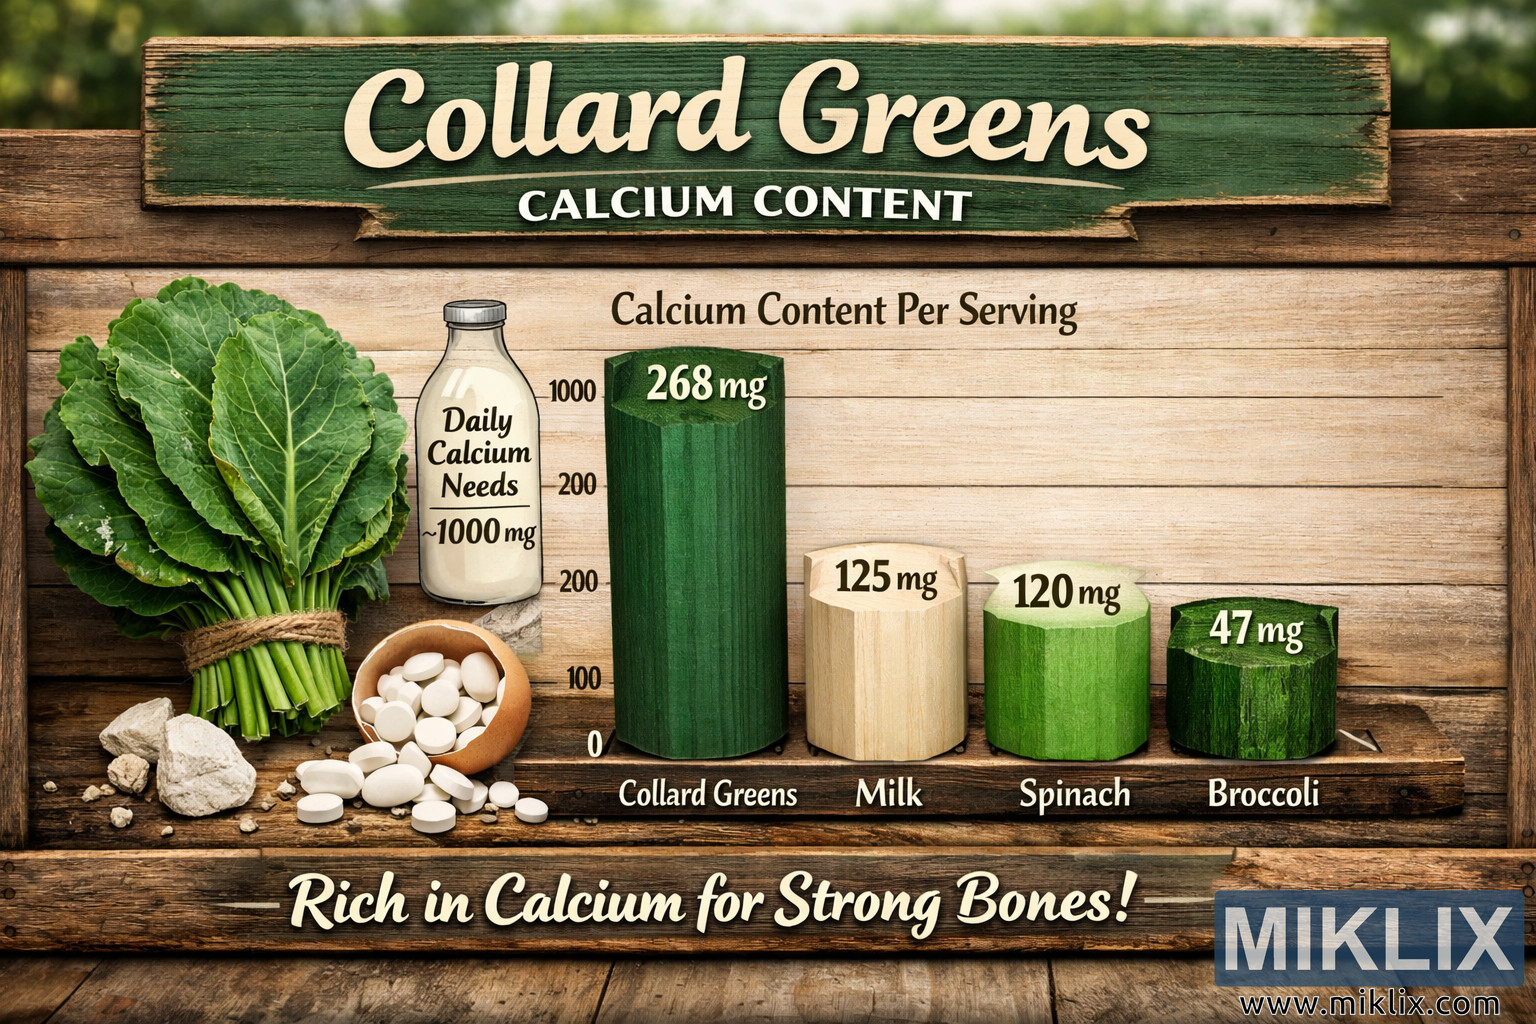
Explore a detailed infographic comparing the calcium content of collard greens, milk, spinach, and broccoli. This educational chart highlights the nutritional richness of collard greens as a calcium source for strong bones.
Collard Greens Calcium Content Comparison Chart
Versi anu sayogi tina gambar ieu
File gambar anu sayogi kanggo diunduh di handap ieu kirang dikomprés sareng résolusina langkung luhur - sareng akibatna, kualitasna langkung luhur - tibatan gambar anu dipasang dina artikel sareng halaman dina halaman wéb ieu, anu langkung dioptimalkeun pikeun ukuran file supados ngirangan konsumsi bandwidth.
Ukuran biasa (1,536 x 1,024)
Ukuran ageung (3,072 x 2,048)
Ukuran anu ageung pisan (4,608 x 3,072)
Ukuran anu ageung pisan (6,144 x 4,096)
Ukuran anu ageung pisan (1,048,576 x 699,051)
- Masih kénéh di upload... ;-)
Pedaran gambar
The image presents a visually engaging educational infographic titled "Collard Greens Calcium Content" designed in a landscape orientation with a rustic, natural aesthetic. The composition is set outdoors on a weathered wooden table, evoking a farm-to-table atmosphere. In the blurred background, lush collard greens plants are visible, their broad, textured leaves glowing in soft daylight, reinforcing the organic theme of the chart. The title section at the top features the words "Collard Greens" in large, cream-colored, bold, slightly curved letters, followed by "CALCIUM CONTENT" in smaller, white, capitalized letters placed on a green wooden sign-like banner. This header immediately establishes the focus of the infographic and draws attention to the nutritional comparison that follows.
On the left side of the chart, a realistic photograph of a bundle of fresh collard greens is displayed. The leaves are deep green, thick, and veined, tied together with a simple piece of twine, symbolizing freshness and simplicity. Beneath this photograph, a cracked eggshell filled with white calcium tablets spills gently onto the table, accompanied by small chalky white rocks, visually representing calcium as a mineral element. This subtle detail connects the concept of dietary calcium to its natural and supplemental forms.
The central portion of the image features a bar graph titled "Calcium Content Per Serving." The graph is rendered in a clean, three-dimensional style, with each bar appearing as a carved wooden cylinder standing upright on the table. The vertical axis on the left is labeled "Milligrams of Calcium (mg)" and ranges from 0 to 1000 in increments of 200, marked in beige text for readability. The horizontal axis lists four categories: "Collard Greens," "Milk," "Spinach," and "Broccoli." Each category is represented by a distinct bar with varying heights and shades of green and beige to differentiate them.
The first bar, labeled "Collard Greens," is the tallest and colored in a rich, dark green hue. Above it, the value "268 mg" is displayed in bold white text, signifying its high calcium content per serving. The second bar, labeled "Milk," is shorter and colored in a light beige tone, with "125 mg" written above it. The third bar, labeled "Spinach," is a lighter green shade with "120 mg" displayed above, while the fourth bar, labeled "Broccoli," is the shortest and darkest green, marked with "47 mg." This visual hierarchy clearly communicates the comparative calcium levels among these foods, emphasizing collard greens as the most calcium-rich option.
To the left of the graph, an illustration of a milk bottle adds a contextual reference point. The bottle is labeled "Daily Calcium Needs ~1000 mg" in beige text, serving as a benchmark for understanding how each food contributes to daily calcium intake. The inclusion of this element provides a relatable scale for viewers, linking the data to everyday nutritional goals.
The overall color palette of the infographic harmonizes earthy tones—greens, browns, and creams—to evoke a sense of natural health and balance. The wooden textures of the table and graph bars complement the organic theme, while the soft lighting enhances the realism and warmth of the scene. The design avoids any branding or commercial imagery, focusing purely on educational and nutritional content.
At the bottom of the chart, a motivational phrase reads "Rich in Calcium for Strong Bones!" in large, cream-colored, cursive letters placed on a wooden plank background. This closing statement reinforces the health message and provides an uplifting conclusion to the visual narrative. The typography throughout the image is clear and legible, blending rustic charm with professional clarity.
The composition is balanced, with the collard greens photo anchoring the left side and the bar graph occupying the center and right. The background blur ensures that the focus remains on the chart and its data while still providing contextual depth. The image successfully combines scientific information with aesthetic appeal, making it both informative and visually pleasing.
Overall, this infographic serves as a compelling visual representation of calcium content across common foods, highlighting collard greens as a superior source. It effectively communicates nutritional data through a blend of photography, illustration, and design, encouraging viewers to appreciate the value of leafy greens in maintaining bone health. The image’s high resolution and landscape orientation make it suitable for educational presentations, health blogs, or dietary awareness campaigns, offering clarity, accuracy, and visual harmony in a single cohesive composition.
Gambar aya hubunganana sareng: Collard Greens: The Leafy Green Your Diet Is Missing