
Picha: Side-by-Side Nutritional Comparison of Shallots, Onions, and Garlic
Iliyochapishwa:
Mara ya mwisho kusasishwa: 5 Agosti 2026, 22:49:26 UTC
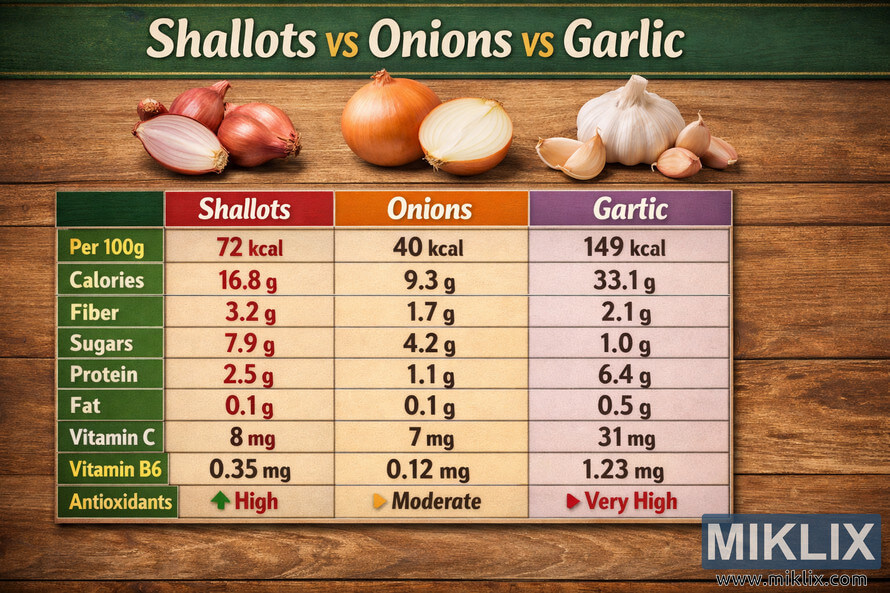
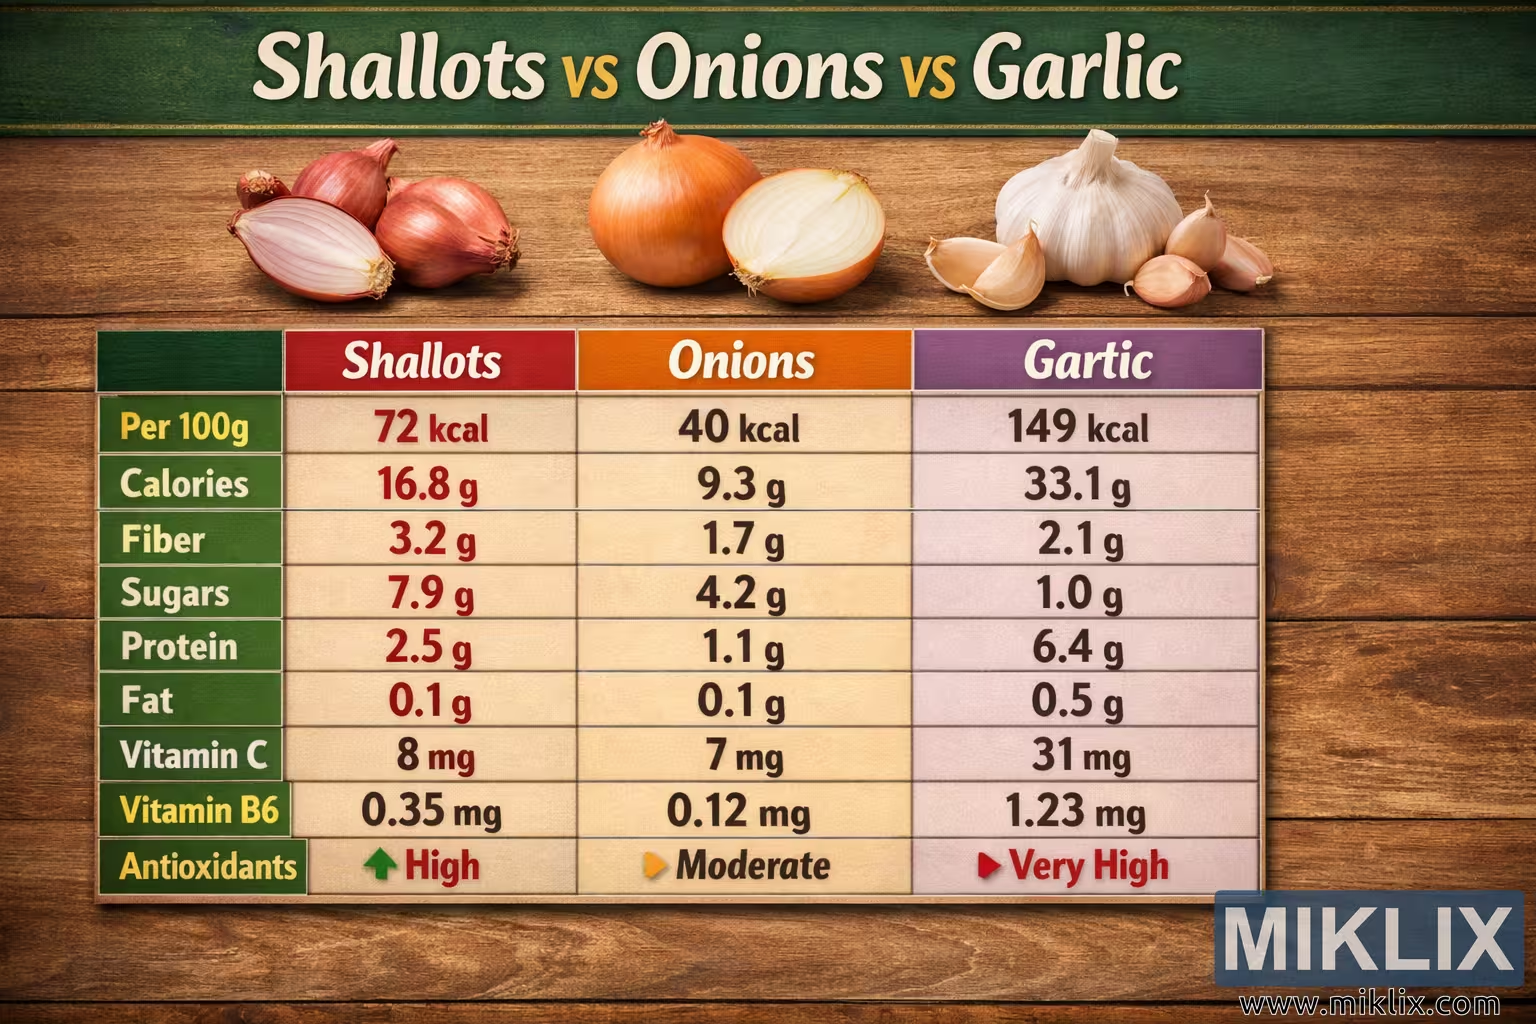
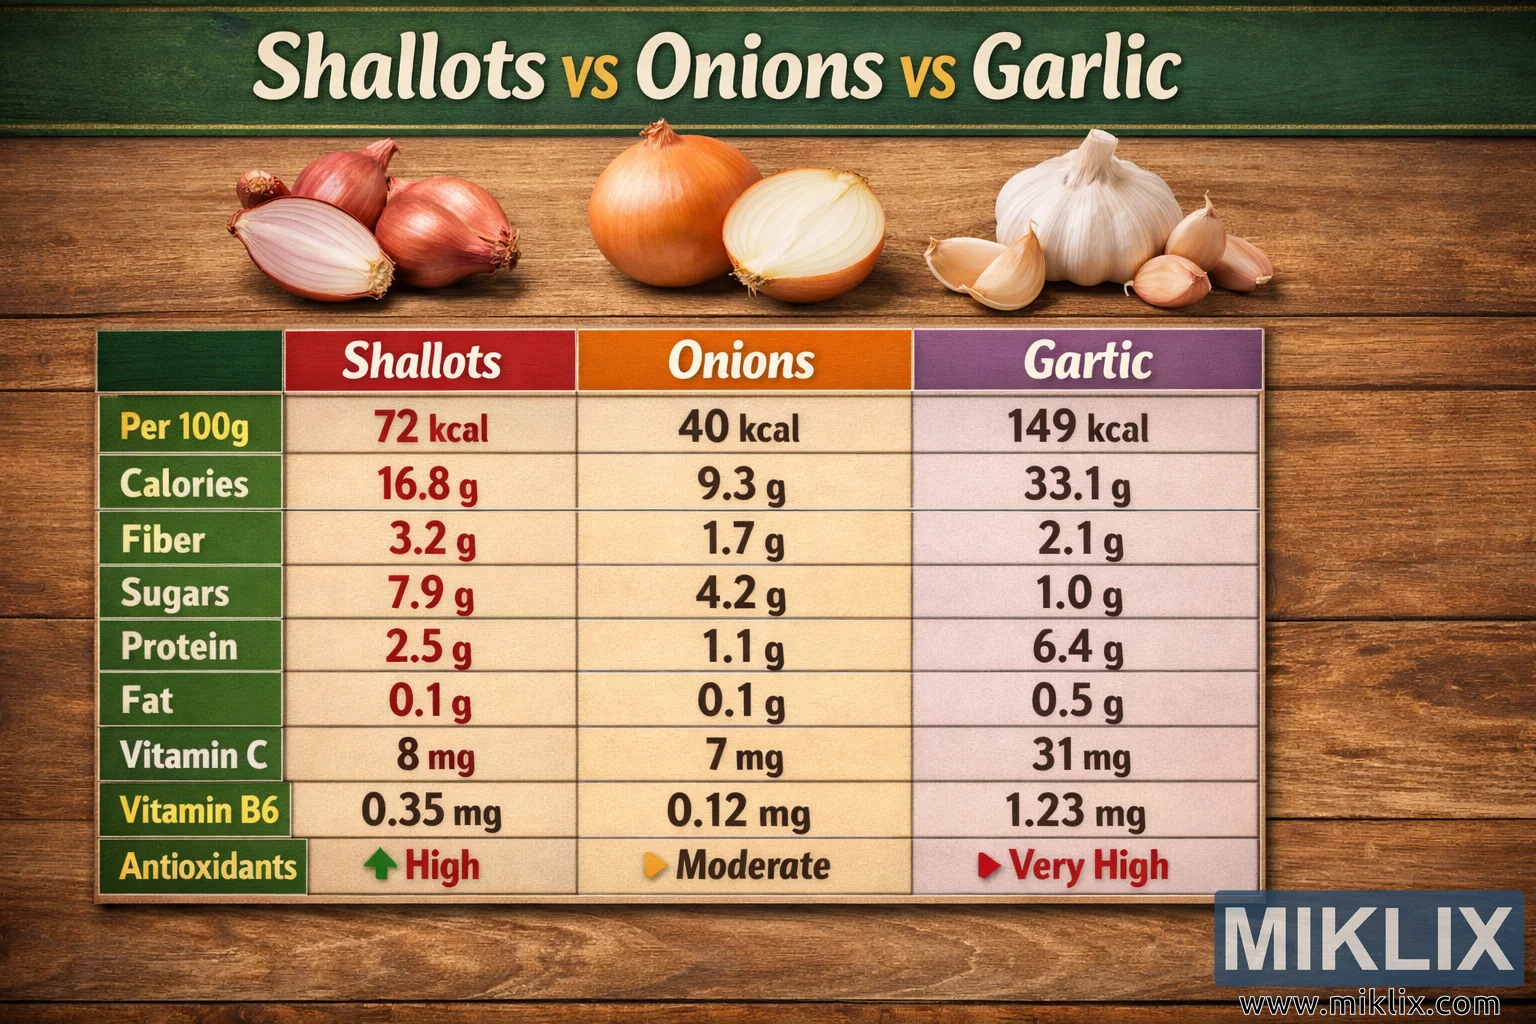
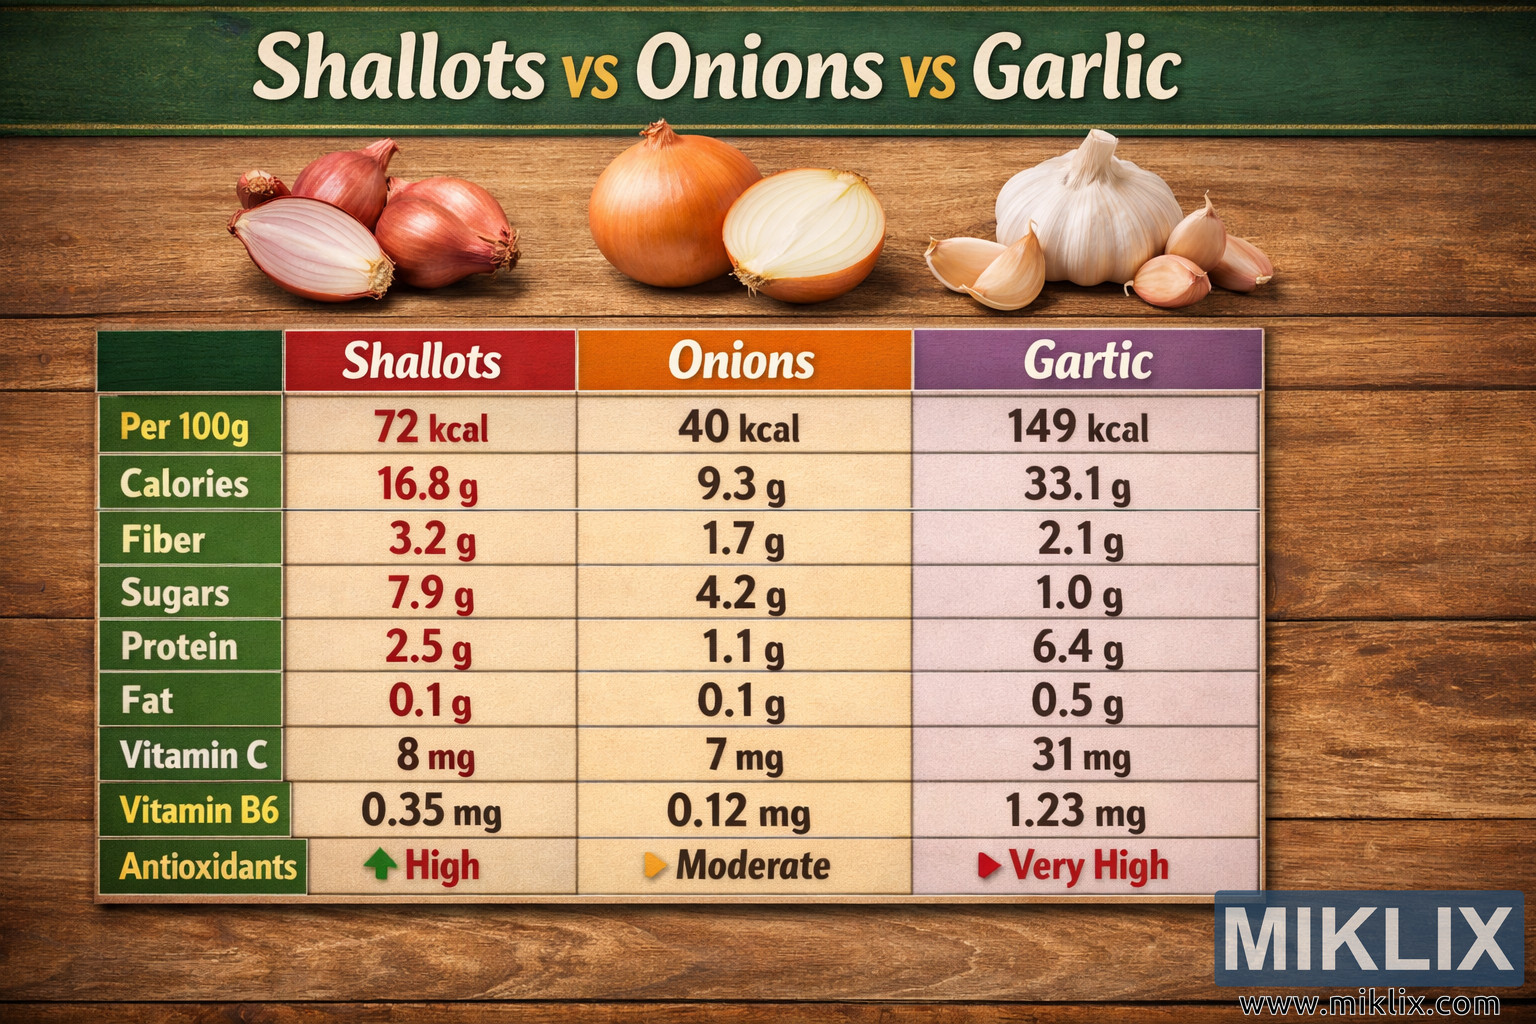
A detailed side-by-side nutritional comparison of shallots, onions, and garlic, featuring an infographic with photos and a chart showing calories, carbs, fiber, sugars, protein, fat, vitamin C, vitamin B6, and antioxidant levels per 100 grams.
Side-by-Side Nutritional Comparison of Shallots, Onions, and Garlic
Matoleo yanayopatikana ya picha hii
Faili za picha zinazopatikana kwa kupakuliwa hapa chini hazijabanwa sana na zina ubora wa juu zaidi - na kutokana na hilo, ubora wa juu zaidi - kuliko picha zilizopachikwa katika makala na kurasa kwenye tovuti hii, ambazo zimeboreshwa zaidi kwa ukubwa wa faili ili kupunguza matumizi ya kipimo data.
Ukubwa wa kawaida (1,536 x 1,024)
Ukubwa mkubwa (3,072 x 2,048)
Ukubwa mkubwa sana (4,608 x 3,072)
Ukubwa mkubwa zaidi (6,144 x 4,096)
Ukubwa mkubwa wa vichekesho (1,048,576 x 699,051)
- Bado inapakia... ;-)
Maelezo ya picha
The image is a high-resolution, landscape-oriented infographic that presents a clear and visually engaging side-by-side nutritional comparison of three closely related aromatic vegetables: shallots, onions, and garlic. The overall design is structured to guide the viewer’s eye from the bold title at the top, through realistic photographic depictions of each vegetable, and down into a detailed comparison chart that lists key nutritional values per 100 grams. The color palette combines natural tones—such as wood textures and green accents—with vivid header colors to make each column distinct and easy to read.
At the very top of the image, centered horizontally, is the main title: "Shallots vs Onions vs Garlic." The title is rendered in large, bold lettering, with a mix of white and yellow text that stands out sharply against a background composed of green hues and a subtle wooden texture. The green suggests freshness and health, while the wood grain evokes a kitchen or cutting board setting, reinforcing the culinary context of the ingredients being compared. The title immediately communicates the purpose of the infographic: to compare these three vegetables in terms of their nutritional profiles.
Directly beneath the title, three high-quality, realistic photos are arranged side by side, each aligned above its corresponding column in the chart below. On the left, the shallots are depicted as small, reddish-brown bulbs, with at least one shallot sliced in half to reveal its pale, slightly purple-tinted interior. The texture of the shallot skin appears papery and delicate, while the interior layers look moist and crisp, emphasizing their freshness. In the center, the onions are represented by a whole golden-brown onion and another onion sliced in half. The halved onion shows its concentric white layers, slightly glossy and firm, capturing the familiar look of a kitchen-ready onion. On the right, garlic is shown as a whole bulb accompanied by several separated cloves. The bulb has a pale, off-white papery skin, while the individual cloves display a smooth, slightly shiny surface, suggesting they are ready to be peeled and used. These photographs serve as visual anchors, helping viewers quickly identify each vegetable before examining the numerical data.
Below the photographs, the main comparison chart occupies the majority of the lower portion of the image. The chart is laid out on a wooden background, which continues the natural, kitchen-like theme. The chart is divided into three vertical columns, each dedicated to one of the vegetables: Shallots, Onions, and Garlic. The column headers are bold and color-coded to differentiate them at a glance. The "Shallots" header is set against a rich red background, the "Onions" header uses a warm orange background, and the "Garlic" header is placed on a light purple background. The text in these headers is white, making the names stand out clearly against their respective colors.
On the far left side of the chart, there is a vertical green band that lists the nutritional categories in white text. This green band acts as a legend for the rows of the chart. The categories are arranged from top to bottom as follows: "Per 100g," "Calories," "Carbs," "Fiber," "Sugars," "Protein," "Fat," "Vitamin C," "Vitamin B6," and "Antioxidants." Each category label is aligned horizontally with the corresponding values in the three columns, creating a grid-like structure that makes it easy to compare the numbers across shallots, onions, and garlic. The use of green for the category column reinforces the theme of health and nutrition, while the white text ensures legibility.
In the "Shallots" column, the nutritional values per 100 grams are presented in a clean, consistent font. The chart lists "72 kcal" for Calories, indicating that shallots provide a moderate energy content compared to the other two vegetables. For Carbs, the value is "16.8 g," showing that shallots are relatively carbohydrate-rich. The Fiber content is "3.2 g," suggesting a decent contribution to dietary fiber. Sugars are listed as "7.9 g," which is relatively high among the three, reflecting the natural sweetness often associated with shallots. Protein is given as "2.5 g," a modest amount, while Fat is listed at "0.1 g," indicating that shallots are very low in fat. For micronutrients, Vitamin C is shown as "8 mg," and Vitamin B6 is "0.35 mg." Finally, the Antioxidants row for shallots is labeled "High," suggesting that shallots offer a significant level of antioxidant compounds.
In the "Onions" column, the values present a different nutritional profile. Calories are listed as "40 kcal," making onions the lowest in energy among the three vegetables. Carbs are shown as "9.3 g," which is lower than shallots and garlic, indicating that onions are comparatively lighter in carbohydrate content. Fiber is listed at "1.7 g," a moderate amount but less than shallots. Sugars are "4.2 g," reflecting a milder sweetness compared to shallots. Protein is "1.1 g," and Fat is again very low at "0.1 g." For vitamins, Vitamin C is listed as "7 mg," slightly less than shallots, and Vitamin B6 is "0.12 mg," which is lower than both shallots and garlic. The Antioxidants row for onions is labeled "Moderate," suggesting that while onions do contain beneficial antioxidant compounds, their levels are not as high as those found in shallots or garlic.
The "Garlic" column presents a more concentrated nutritional profile. Calories are listed as "149 kcal," making garlic the highest in energy per 100 grams among the three vegetables. Carbs are shown as "33.1 g," indicating a substantial carbohydrate content. Fiber is listed at "2.1 g," which is lower than shallots but higher than onions. Sugars are "1.0 g," relatively low compared to shallots and onions, reflecting garlic’s more pungent, less sweet flavor. Protein is given as "6.4 g," making garlic notably higher in protein than both shallots and onions. Fat is listed at "0.5 g," still low but higher than the fat content in shallots and onions. For vitamins, Vitamin C is shown as "31 mg," a significantly higher value that highlights garlic’s potential contribution to vitamin C intake. Vitamin B6 is listed as "1.23 mg," which is markedly higher than the values for shallots and onions. The Antioxidants row for garlic is labeled "Very High," emphasizing garlic’s reputation for being rich in antioxidant compounds and bioactive substances.
At the bottom of the chart, there is a small legend that visually explains the antioxidant levels using colored arrows. A green arrow is placed next to the word "High," a yellow arrow appears next to "Moderate," and a red arrow is shown next to "Very High." These arrows provide a quick visual cue for interpreting the antioxidant labels in the chart above. Interestingly, the color choices invert typical warning schemes—red here is associated with "Very High" antioxidants, which is a positive attribute rather than a danger signal. The legend reinforces the idea that antioxidant levels are being compared qualitatively, not just numerically.
The composition of the infographic is carefully balanced. The top section with the title and photographs draws the viewer in with visual appeal and context, while the lower section with the chart delivers precise, structured information. The wooden background and green accents create a warm, natural atmosphere, suggesting that these vegetables are wholesome, everyday ingredients that can contribute to a healthy diet. The use of distinct header colors for each vegetable column helps prevent confusion and makes it easy to track values across the chart.
Overall, the image functions as both an educational tool and a visually pleasing design. It allows viewers to quickly compare shallots, onions, and garlic across multiple nutritional dimensions: energy (calories), macronutrients (carbs, fiber, sugars, protein, fat), vitamins (Vitamin C and Vitamin B6), and antioxidant levels. The realistic photos at the top remind the viewer of the familiar appearance of each vegetable, while the chart below translates that familiarity into concrete nutritional information. The infographic is suitable for use in articles, blogs, or presentations about nutrition, cooking, or healthy eating, especially when highlighting the differences and similarities among these three aromatic vegetables.
Picha inahusiana na: Shallots: The Small Vegetable with Big Nutritional Benefits