
影像: Endive Nutritional Composition Infographic
已發佈:
最後更新: 2026年5月24日 下午3:46:33 [UTC]
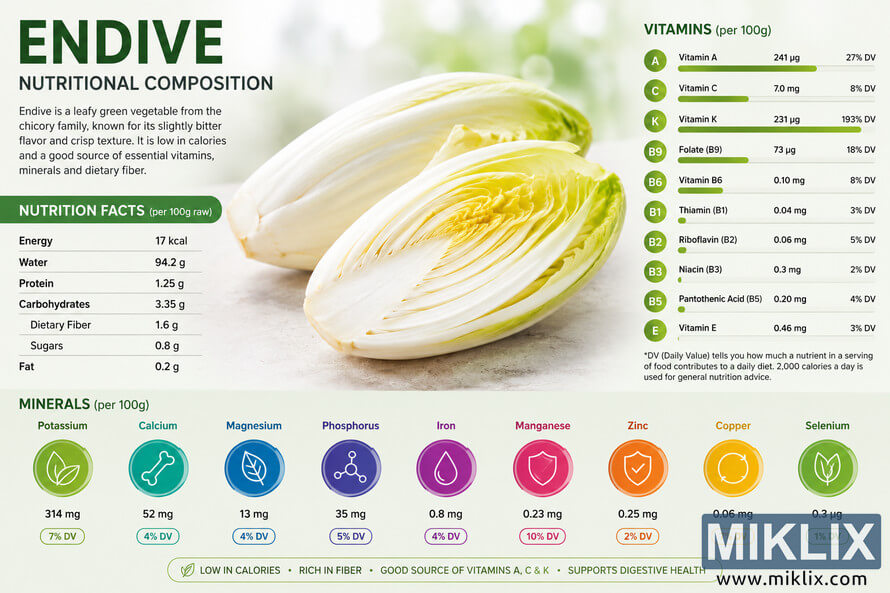
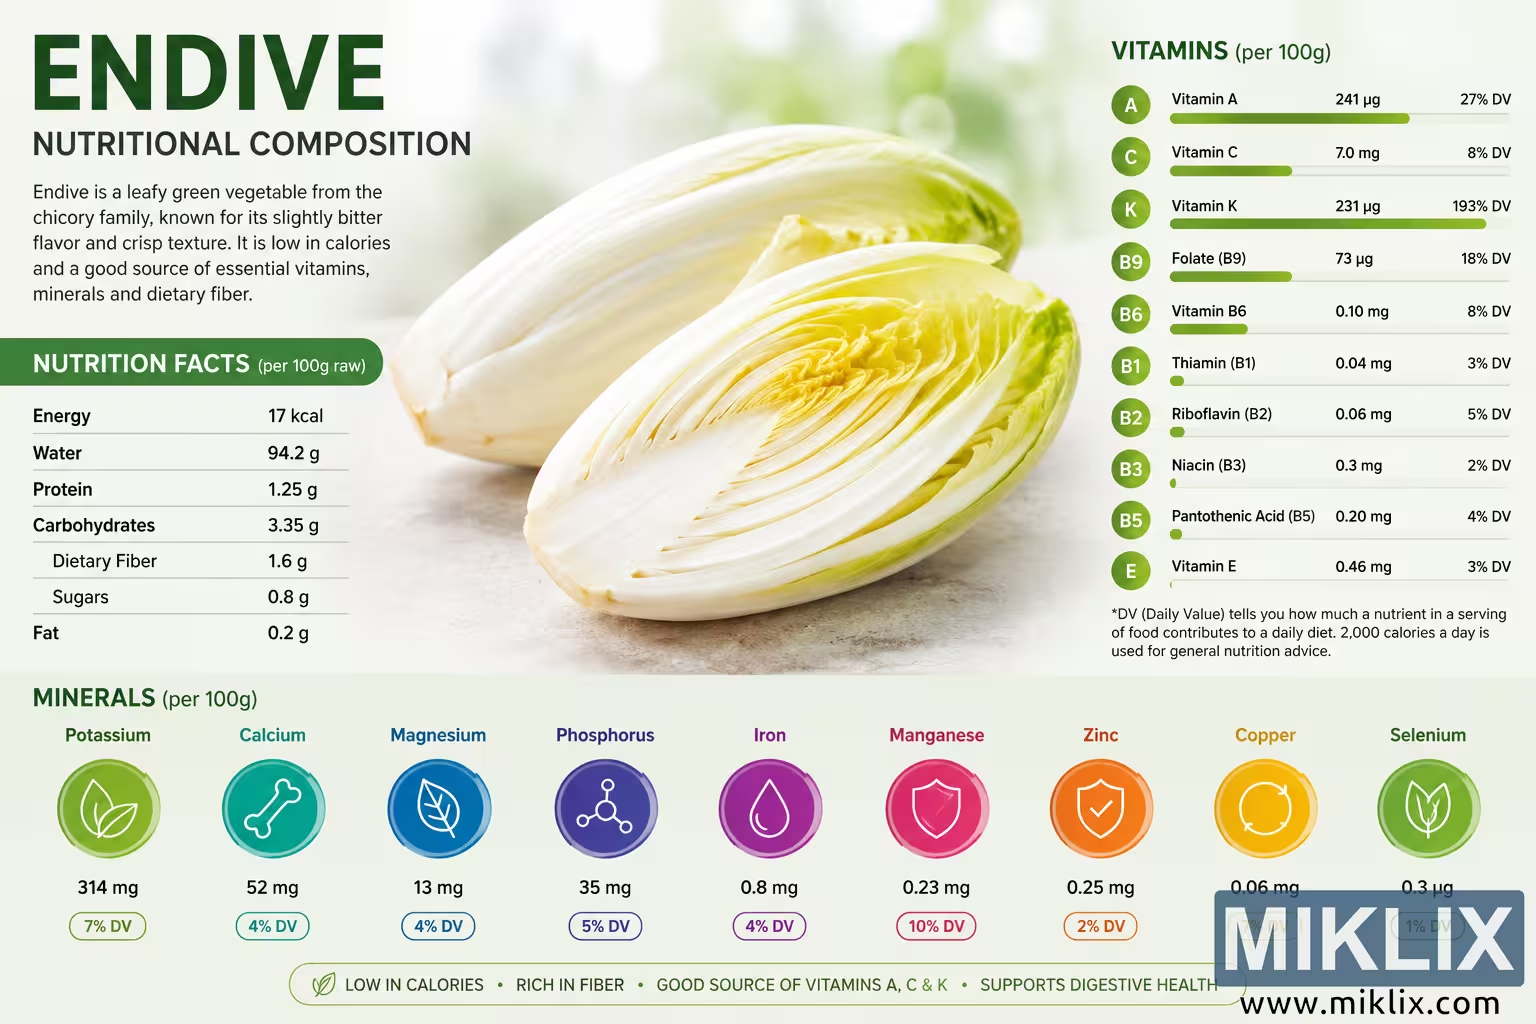
Visual infographic of endive nutritional composition, including calories, macronutrients, vitamins, minerals, daily values, and health benefits.
Endive Nutritional Composition Infographic
此圖片的可用版本
以下可供下載的圖片檔案壓縮程度較低,解析度也較高 - 因此品質也較高 - 相較於本網站文章和網頁中內嵌的圖片,這些圖片的檔案大小經過優化,以減少頻寬消耗。
一般尺寸 (1,536 x 1,024)
大尺寸 (3,072 x 2,048)
非常大的尺寸 (4,608 x 3,072)
超大尺寸 (6,144 x 4,096)
超大尺寸 (1,048,576 x 699,051)
- 仍在上傳中... ;-)
圖片說明
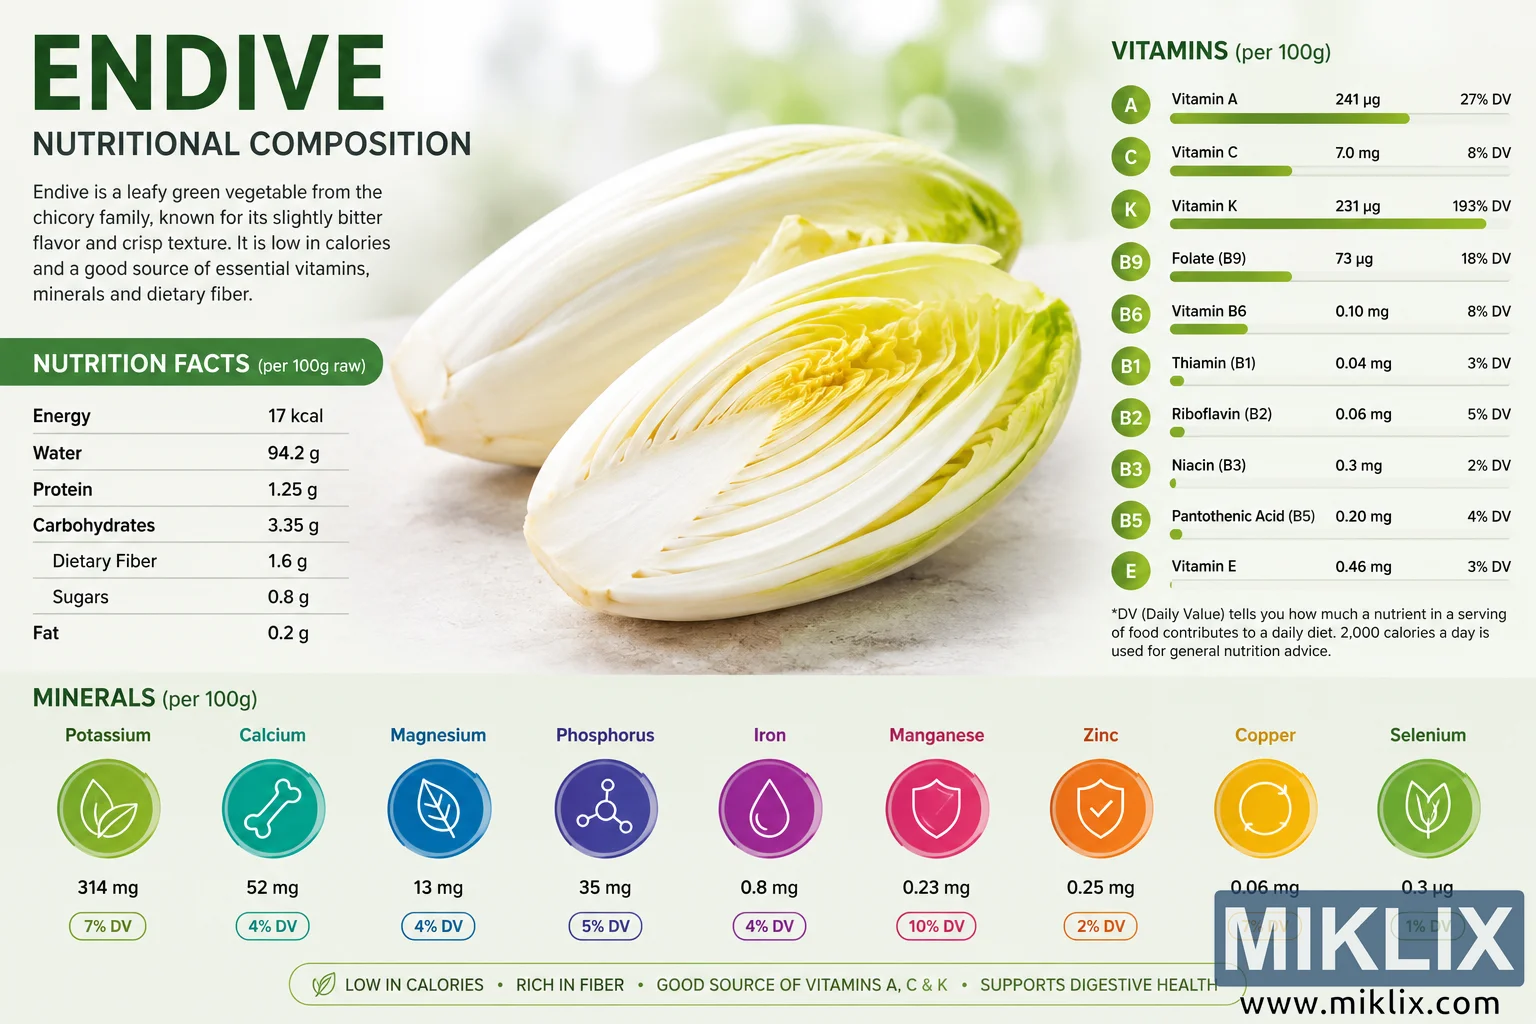
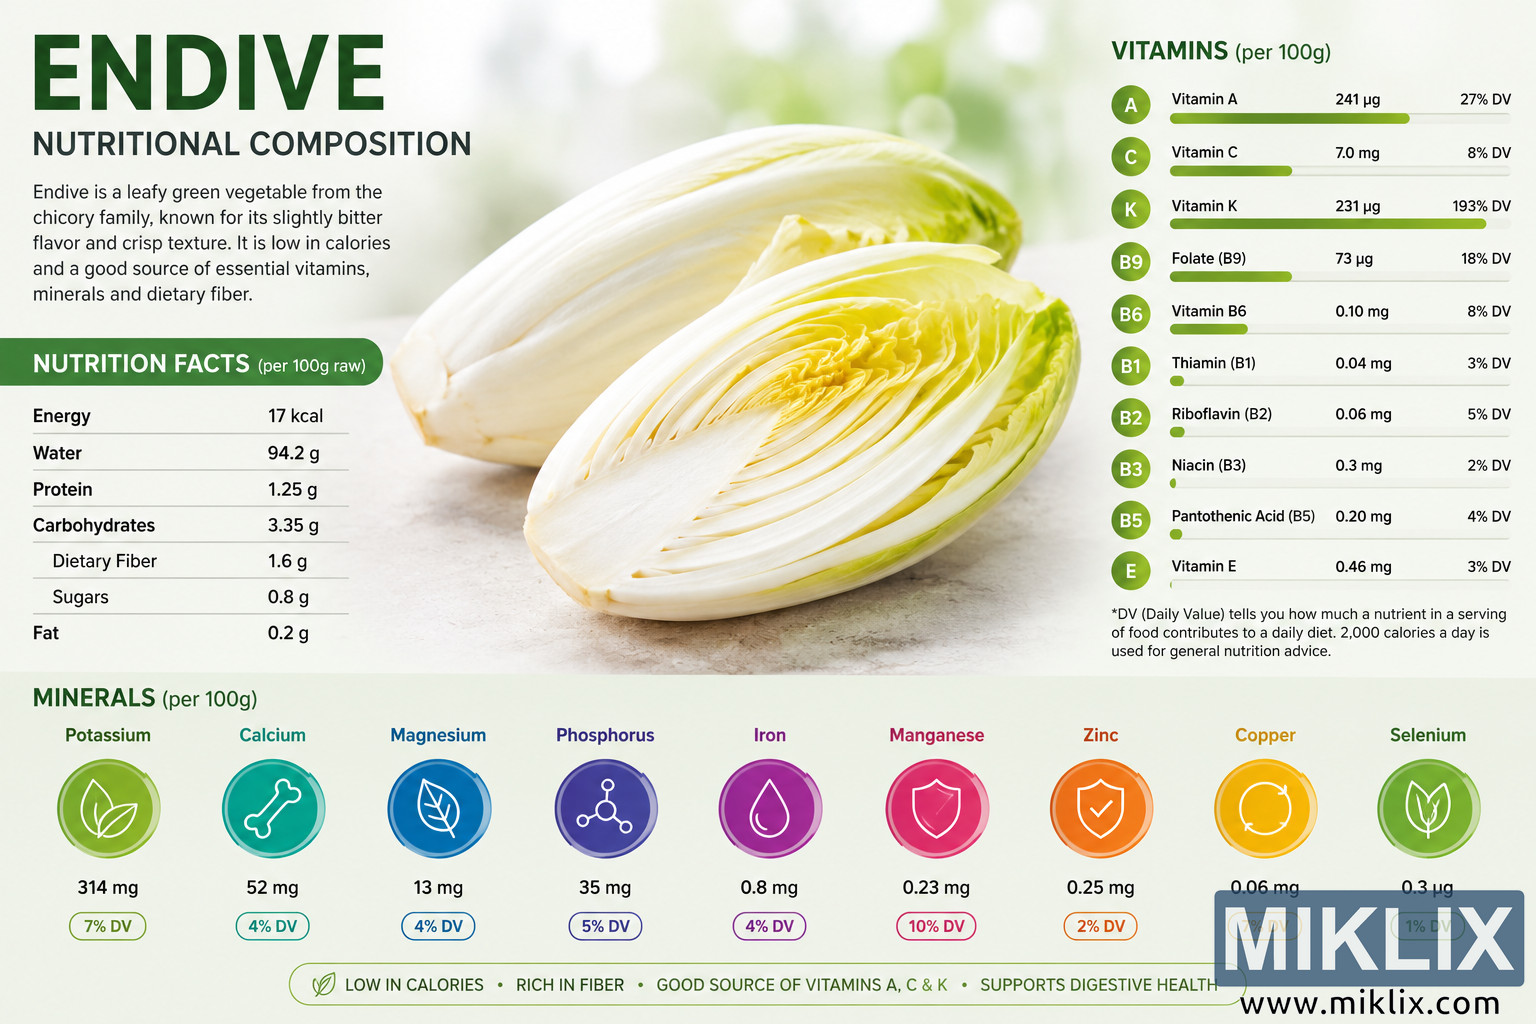
A wide landscape-format nutritional infographic presents endive as the central subject, combining a clean photographic food image with structured educational data. The composition is bright, fresh, and health-focused, using a soft white and pale green background with gentle bokeh lighting to create a natural, organic atmosphere. In the middle of the design, two large heads of endive are shown in crisp photographic detail. One endive is whole and positioned slightly behind the other, while the front endive is sliced lengthwise to reveal tightly layered pale yellow, cream, and light green leaves. The cut surface displays the vegetable’s smooth ribbed structure, curved leaf tips, and delicate texture. The endives rest on a light stone or kitchen-counter surface, giving the image a fresh produce and healthy-eating feel. On the upper left, a large bold heading reads “ENDIVE” in deep green uppercase lettering, followed by the subtitle “NUTRITIONAL COMPOSITION.” Beneath the title is a short explanatory paragraph describing endive as a leafy green vegetable from the chicory family, known for its slightly bitter flavor and crisp texture. The text notes that endive is low in calories and a good source of vitamins, minerals, and dietary fiber. On the left side below this introduction is a rectangular nutrition facts panel with a rounded green header reading “NUTRITION FACTS (per 100g raw).” The panel lists basic macronutrient information in a table-like format, including energy at 17 kcal, water at 94.2 g, protein at 1.25 g, carbohydrates at 3.35 g, dietary fiber at 1.6 g, sugars at 0.8 g, and fat at 0.2 g. Thin divider lines separate each row, and the values are aligned neatly to the right, creating a familiar food-label appearance. On the right side of the image is a vertical vitamins section titled “VITAMINS (per 100g).” Each vitamin appears as a row with a round green badge containing the vitamin letter or abbreviation, followed by the vitamin name, quantity, daily value percentage, and a horizontal progress bar. The vitamins listed include Vitamin A at 241 µg and 27% DV, Vitamin C at 7.0 mg and 8% DV, Vitamin K at 231 µg and 193% DV, Folate or Vitamin B9 at 73 µg and 18% DV, Vitamin B6 at 0.10 mg and 8% DV, Thiamin or B1 at 0.04 mg and 3% DV, Riboflavin or B2 at 0.06 mg and 5% DV, Niacin or B3 at 0.3 mg and 2% DV, Pantothenic Acid or B5 at 0.20 mg and 4% DV, and Vitamin E at 0.46 mg and 3% DV. The progress bars emphasize that Vitamin K is especially prominent, with the longest green bar. A small note under the vitamin list explains that DV, or Daily Value, tells how much a nutrient in a serving contributes to a daily diet, based on 2,000 calories a day for general nutrition advice. Along the bottom third of the image is a minerals section labeled “MINERALS (per 100g).” This section uses a row of colorful circular icons, each with a simple white line symbol inside. The minerals are displayed from left to right with names, amounts, and daily value badges beneath them. Potassium is shown with a green leaf icon and listed as 314 mg and 7% DV. Calcium is shown with a teal bone icon and listed as 52 mg and 4% DV. Magnesium uses a blue leaf icon and is listed as 13 mg and 4% DV. Phosphorus appears with a purple molecule-style icon and is listed as 35 mg and 5% DV. Iron uses a magenta droplet icon and is listed as 0.8 mg and 4% DV. Manganese uses a pink shield icon and is listed as 0.23 mg and 10% DV. Zinc uses an orange shield or checkmark icon and is listed as 0.25 mg and 2% DV. Copper uses a yellow circular arrow icon and is listed as 0.06 mg and 7% DV. Selenium appears with a green leaf icon and is listed as 0.3 µg and 1% DV. At the very bottom, a slim rounded banner highlights key benefits with small separators: low in calories, rich in fiber, good source of vitamins A, C, and K, and supports digestive health. The overall visual style is polished and infographic-oriented, blending realistic food photography with modern data visualization. The typography is bold and readable, the color palette emphasizes greens and natural tones, and the layout balances the large endive image with clear nutritional information. The image contains no visible brand names, logos, packaging, or trademarked elements, making it suitable for general educational, wellness, nutrition, or food-related use.