
影像: Nutritional Power of Potatoes Infographic
已發佈:
最後更新: 2026年8月4日 下午1:57:15 [UTC]
A colorful nutritional breakdown chart of potatoes, showing vitamins, minerals, macronutrients, and health-focused facts in a clean landscape infographic format.
Nutritional Power of Potatoes Infographic
此圖片的可用版本
以下可供下載的圖片檔案壓縮程度較低,解析度也較高 - 因此品質也較高 - 相較於本網站文章和網頁中內嵌的圖片,這些圖片的檔案大小經過優化,以減少頻寬消耗。
一般尺寸 (1,536 x 1,024)
大尺寸 (3,072 x 2,048)
非常大的尺寸 (4,608 x 3,072)
超大尺寸 (6,144 x 4,096)
超大尺寸 (1,048,576 x 699,051)
- 仍在上傳中... ;-)
圖片說明
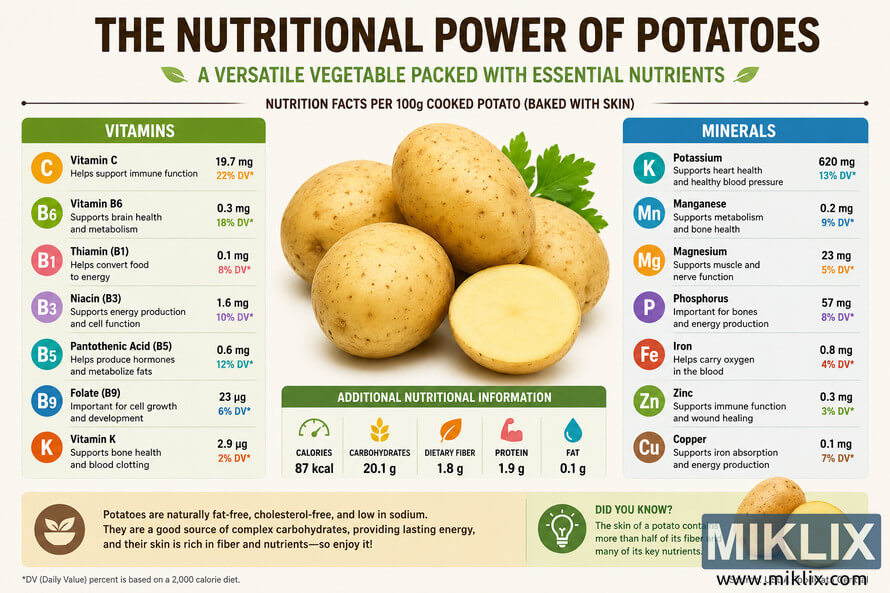
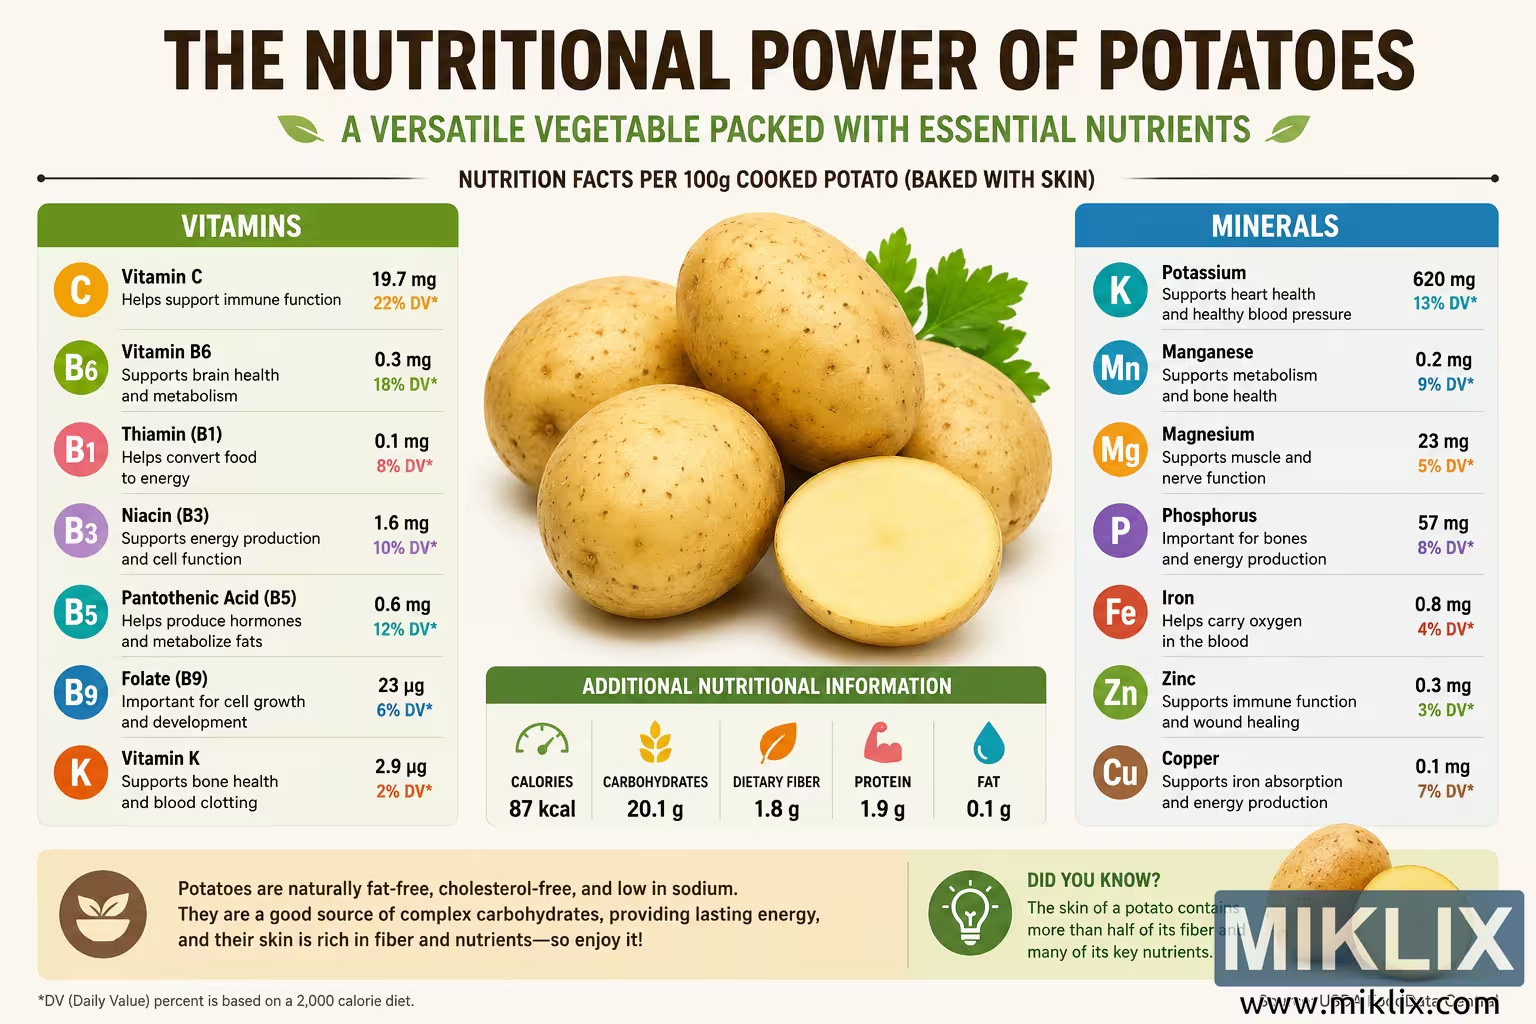
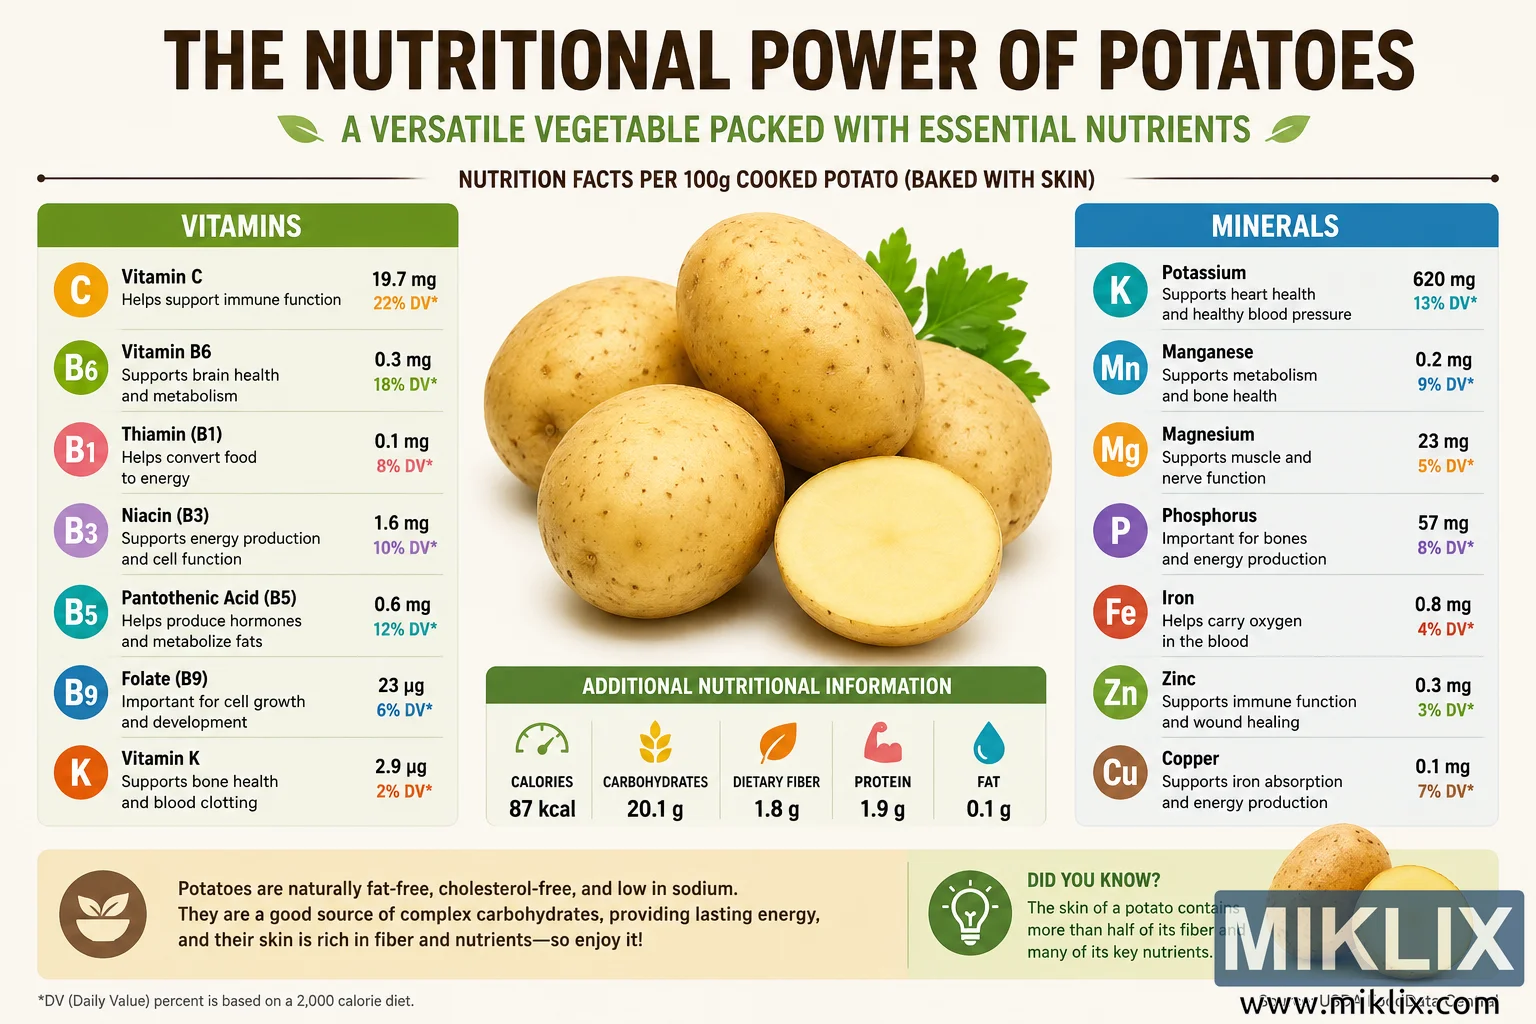
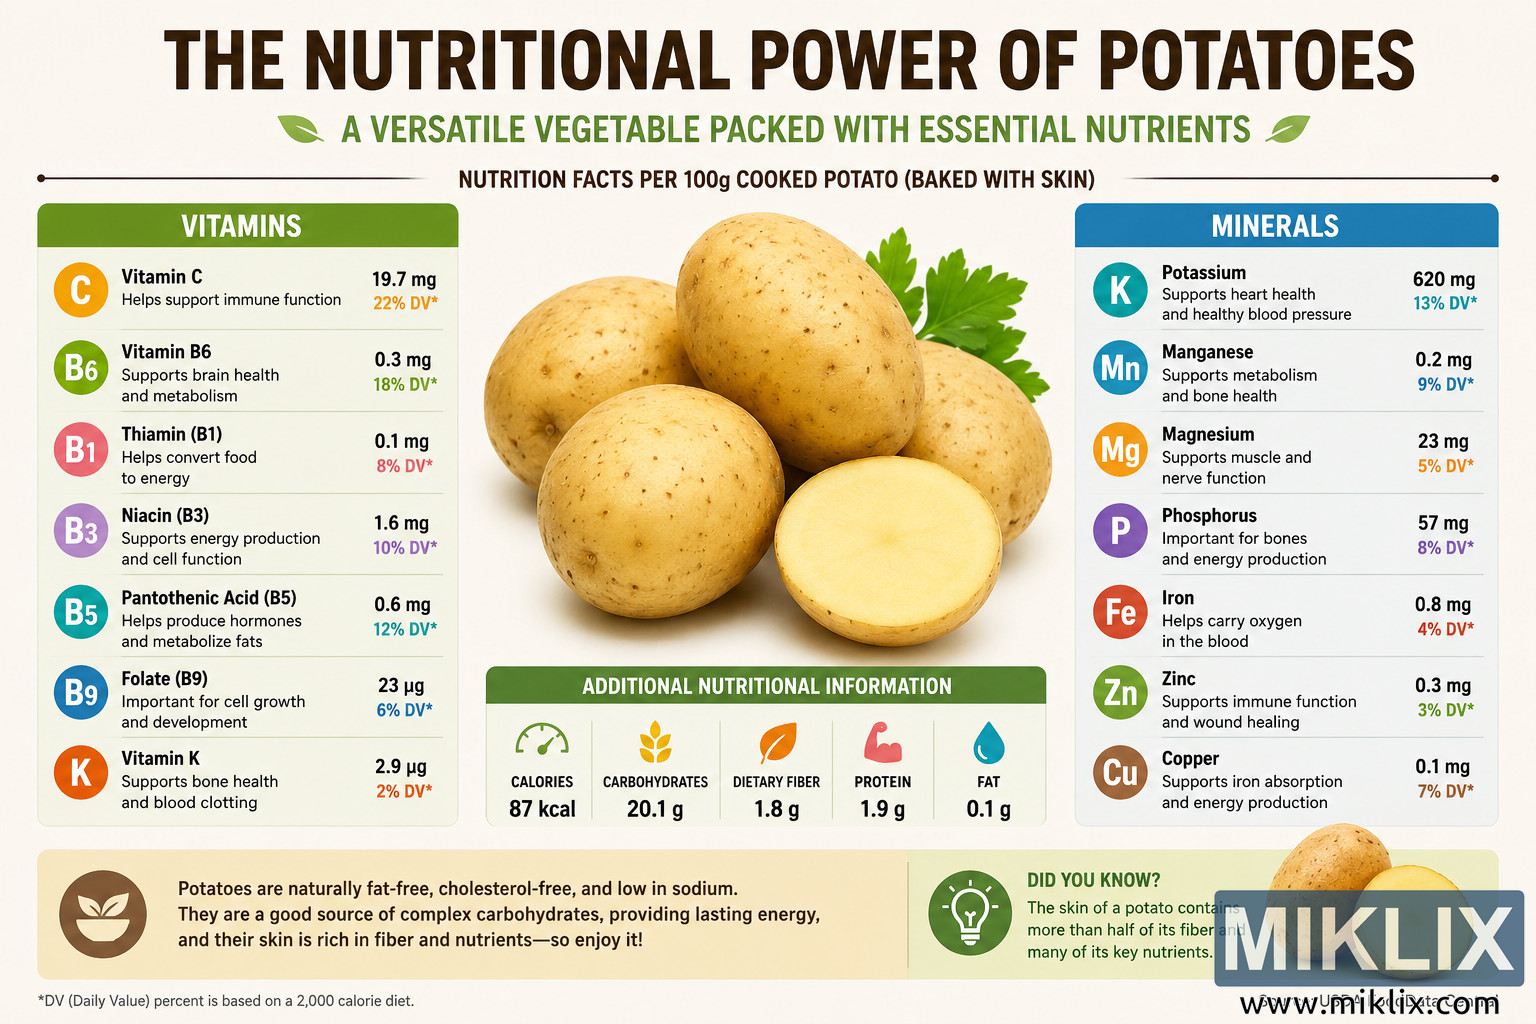
A wide landscape-format nutritional infographic presents the theme “The Nutritional Power of Potatoes” in large bold lettering across the top, with a green subtitle describing potatoes as a versatile vegetable packed with essential nutrients. The overall design has a clean, bright, editorial look with a warm cream background, soft shadows, rounded information panels, and colorful iconography. At the center of the image is a realistic photo-style cluster of golden potatoes, including several whole potatoes and one cut potato half showing the pale yellow interior. Fresh green herb leaves sit behind the potatoes, adding freshness and color contrast. Beneath the main title, a line of text states that the nutrition facts are based on 100 g cooked potato, baked with skin. The composition is balanced like a health poster: vitamins are displayed in a tall panel on the left, minerals are displayed in a matching panel on the right, and additional nutrition facts are summarized in a smaller panel under the potato photo.
The left panel is labeled “Vitamins” with a green header and contains a stacked list of vitamin entries. Each entry has a round colorful badge with the nutrient abbreviation, a bold nutrient name, a short benefit statement, and a quantity with a daily value percentage. The listed vitamins include Vitamin C, Vitamin B6, Thiamin B1, Niacin B3, Pantothenic Acid B5, Folate B9, and Vitamin K. The short notes connect each vitamin to functions such as immune support, brain health, metabolism, energy conversion, cell function, cell growth, bone health, and blood clotting. The design uses different badge colors for each vitamin, making the panel easy to scan.
The right panel is labeled “Minerals” with a blue header and follows the same structured format. It lists potassium, manganese, magnesium, phosphorus, iron, zinc, and copper. Each mineral is represented with a circular icon containing its chemical-style abbreviation, paired with a bold name, a supportive health note, and the amount per serving with daily value percentages. Potassium is emphasized near the top with a larger amount, while the other minerals are arranged below in neat rows. The health notes mention heart health, blood pressure, metabolism, bone health, muscle and nerve function, oxygen transport, wound healing, and iron absorption. The colors are vivid but organized, helping the viewer distinguish nutrients quickly.
Below the central potato image is a green-topped section titled “Additional Nutritional Information.” This compact row uses simple icons and bold numbers to summarize macronutrient and energy values. It lists calories at 87 kcal, carbohydrates at 20.1 g, dietary fiber at 1.8 g, protein at 1.9 g, and fat at 0.1 g. Each value is paired with an icon such as a gauge, wheat, leaf, flexed arm, or water droplet, giving the infographic a friendly visual rhythm. The row reinforces that potatoes are mostly a source of complex carbohydrates and are naturally very low in fat.
At the bottom, a wide horizontal information band contains two callout areas. On the left, a bowl-and-leaf icon accompanies a short message saying potatoes are naturally fat-free, cholesterol-free, and low in sodium, and that they provide complex carbohydrates for lasting energy. On the right, a “Did You Know?” callout with a green lightbulb icon explains that the skin of a potato contains more than half of its fiber and many key nutrients, encouraging the viewer to enjoy the potato skin. A small decorative potato illustration appears at the lower right beside this callout. At the very bottom edge, a small note explains that daily value percentages are based on a 2,000-calorie diet, and a source line credits USDA FoodData Central. The image has no visible commercial branding and reads like an educational nutrition poster suitable for a website article, classroom handout, wellness presentation, or healthy eating guide.
圖像相關: The Surprising Health Benefits of Potatoes: A Complete Nutrition Guide