
Image: Yeast Cell Viability Over Time in Liquid Cultures
Published: September 23, 2026 at 9:53:23 PM UTC
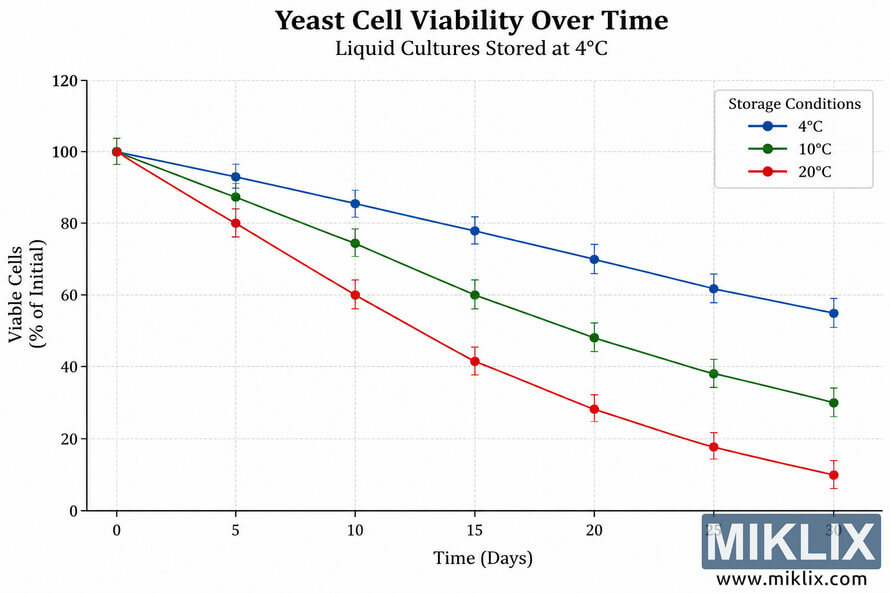
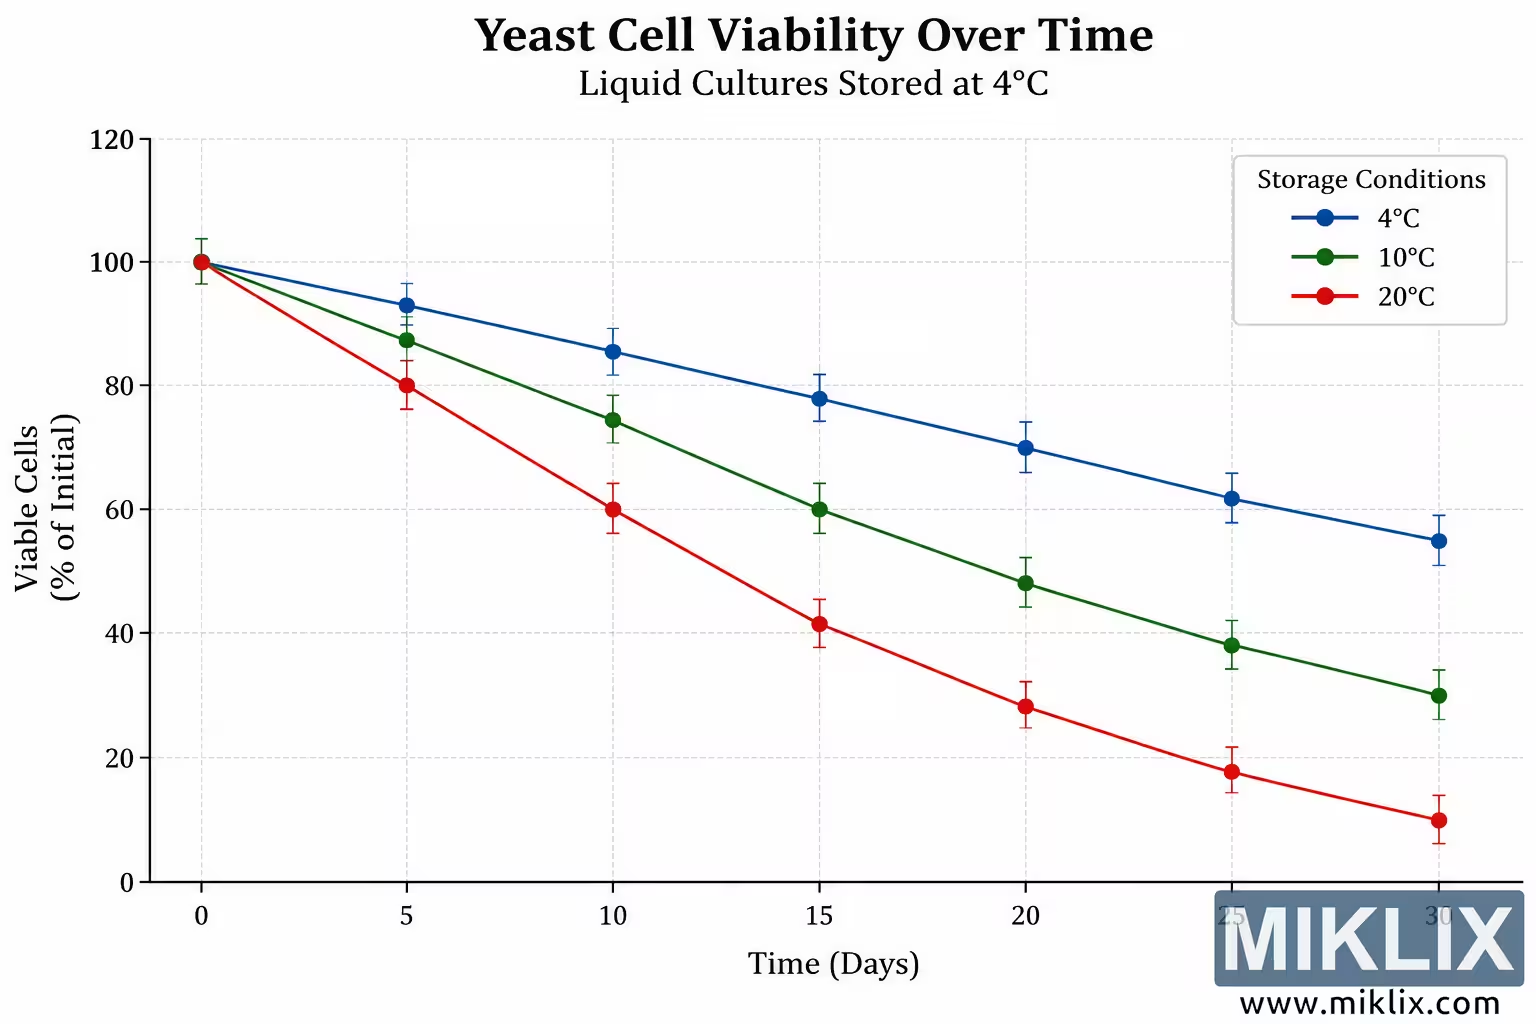
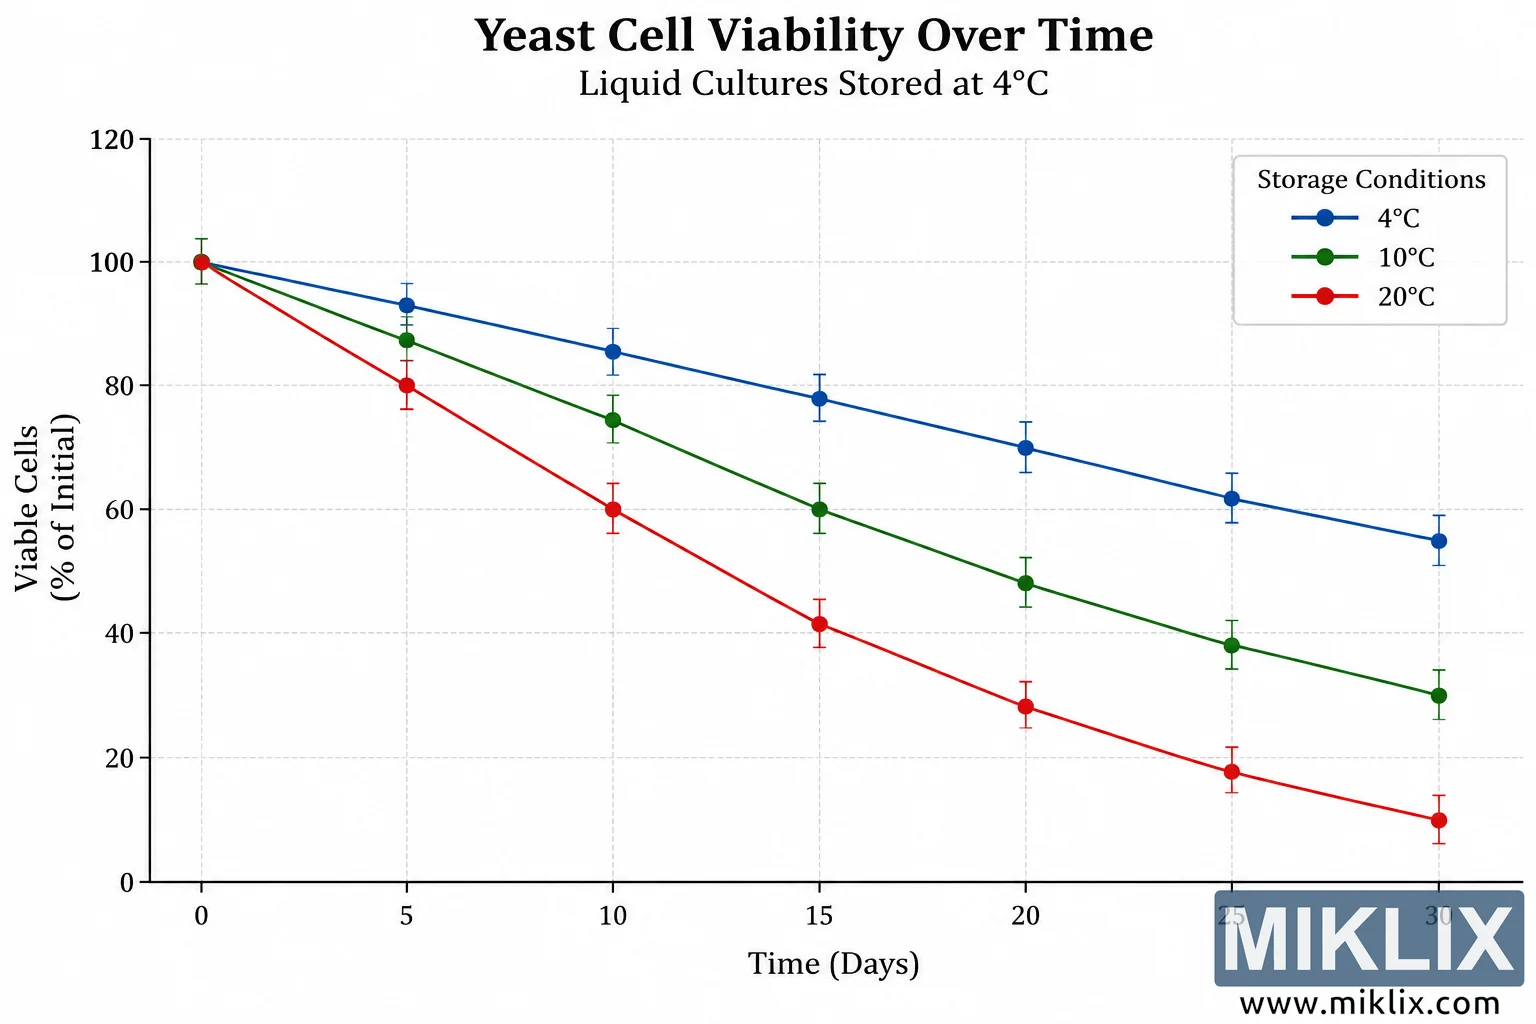
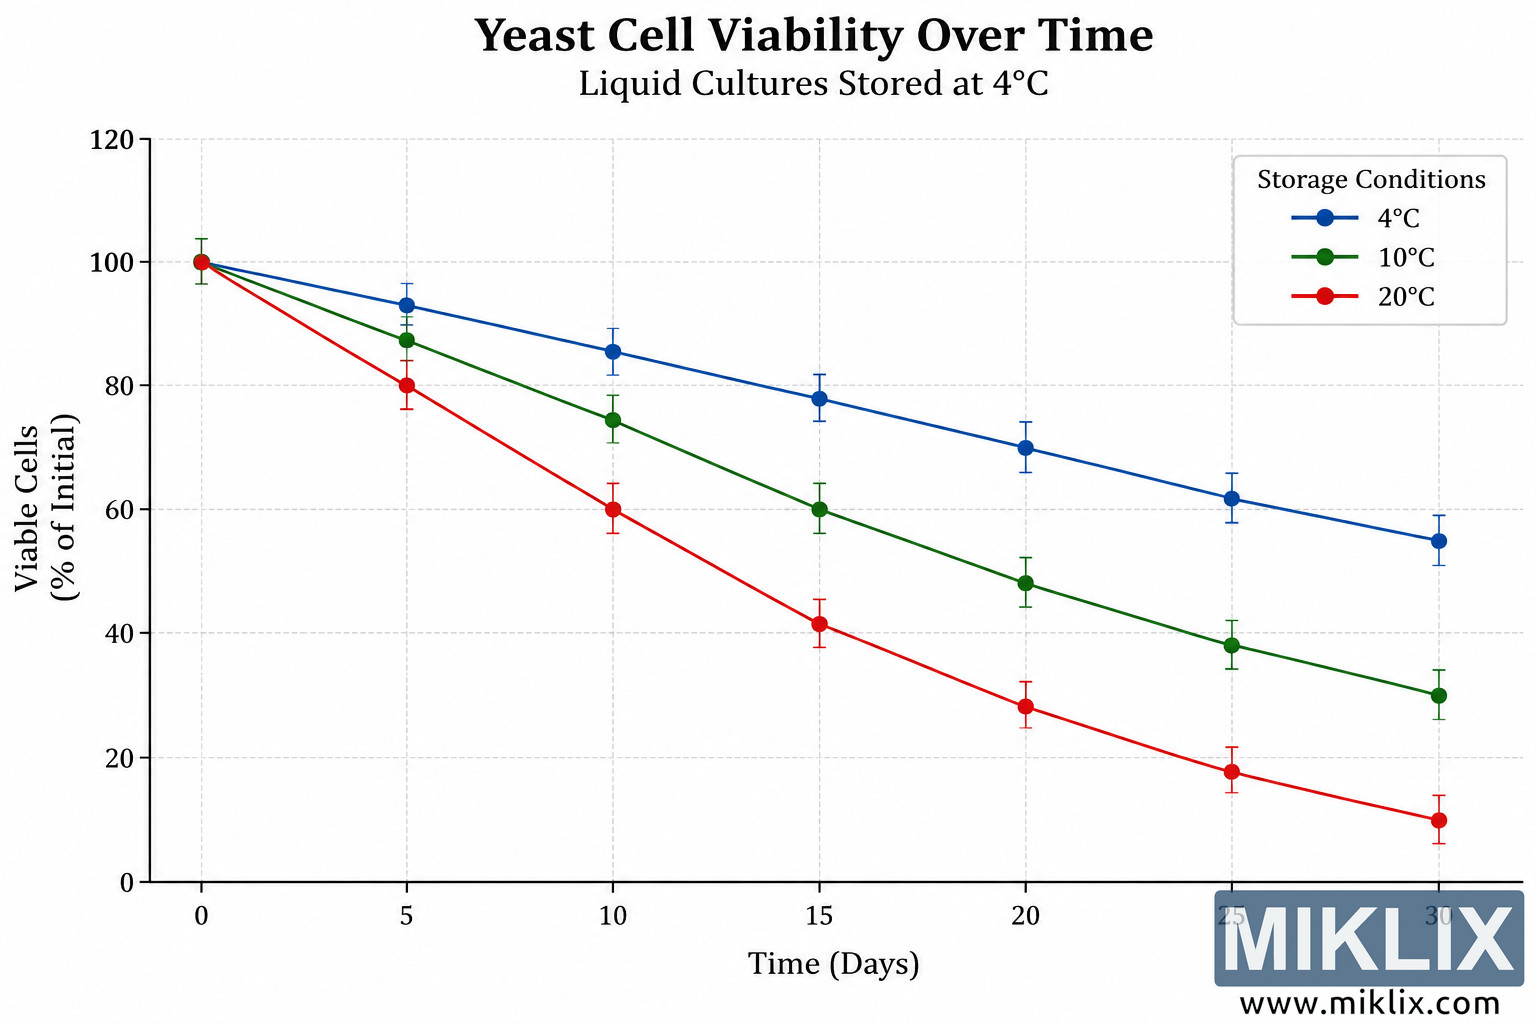
Scientific chart illustrating the decline in yeast cell viability over 30 days in liquid cultures stored at 4°C, 10°C, and 20°C, with markers and error bars.
Available versions of this image
The image files available for download below are less compressed and higher resolution - and as a result of that, higher quality - than the images embedded in articles and pages on this website, which are more optimized for file size in order to reduce bandwidth consumption.
Regular size (1,536 x 1,024)
Large size (3,072 x 2,048)
Very large size (4,608 x 3,072)
Extra large size (6,144 x 4,096)
Comically large size (1,048,576 x 699,051)
- Still uploading... ;-)
Image description
The image is a clean, landscape-oriented scientific line chart titled “Yeast Cell Viability Over Time.” Directly beneath the main title is the subtitle “Liquid Cultures Stored at 4°C.” The visualization occupies most of the image and is presented against a plain white background, giving it the appearance of a figure prepared for a scientific report, laboratory presentation, educational resource, or research publication. There are no commercial logos, product names, watermarks, or other brand identifiers anywhere in the image.
The horizontal x-axis is labeled “Time (Days)” and represents the duration of storage. It begins at day 0 and extends to day 30, with plotted measurements at 0, 5, 10, 15, 20, 25, and 30 days. The vertical y-axis is labeled “Viable Cells (% of Initial)” and represents the percentage of viable yeast cells remaining relative to the initial population. The y-axis begins at 0 and extends to 120, with major labeled intervals at 0, 20, 40, 60, 80, 100, and 120. Light gray dashed horizontal and vertical gridlines cross the plotting area, making it easier to compare the positions of the individual measurements with their corresponding time and viability values. The left and bottom axis lines are dark and clearly defined, while the overall design remains uncluttered and highly legible.
Three separate colored line series illustrate how yeast cell viability decreases over time under different storage temperatures. A legend in a pale rectangular box appears in the upper-right portion of the chart. The legend is headed “Storage Conditions” and identifies the three series as 4°C, 10°C, and 20°C. The 4°C condition is represented by a blue line with blue circular data markers, the 10°C condition by a green line with green circular markers, and the 20°C condition by a red line with red circular markers. Each plotted point also includes a narrow vertical error bar with small horizontal caps, suggesting experimental variation or uncertainty around the measured viability value.
At day 0, all three storage conditions begin at approximately 100% viable cells, establishing a common initial reference point. Their markers overlap or nearly overlap at the 100% level. From this shared starting point, the three curves progressively separate as storage time increases. The separation visually communicates that warmer storage is associated with a faster decline in viability in this illustrative chart.
The blue 4°C series shows the slowest and most gradual decline. Starting at approximately 100% viability on day 0, it falls only modestly to roughly 93% by day 5. At day 10, the blue point is near 85%, followed by approximately 78% at day 15. The series continues downward to about 70% at day 20 and around 62% at day 25. By day 30, the blue series ends at approximately 55% viability. The blue line therefore remains above both of the other series throughout the storage period after the initial measurement, visually indicating the greatest retention of viable cells among the three conditions shown.
The green 10°C series displays an intermediate rate of decline. It also begins at approximately 100% on day 0 but drops to about 87% by day 5. By day 10, viability is around 74–75%, and at day 15 it has fallen to approximately 60%. The green series reaches just under 50%, approximately 48%, at day 20. At day 25 it is around 38%, and by day 30 only approximately 30% of the initial viable-cell level remains. The green curve consistently lies between the blue and red curves after day 0, creating a clear visual progression in which the decline becomes steeper as the represented storage temperature increases.
The red 20°C series shows the fastest reduction in yeast viability. After beginning near 100% at day 0, it drops sharply to approximately 80% by day 5 and then to around 60% by day 10. At day 15, the red marker is slightly above 40%, approximately 41–42%. The value decreases further to roughly 28% at day 20 and approximately 17–18% at day 25. By day 30, the red series reaches only about 10% viability. Its line is visibly steeper than those of the blue and green series, particularly during the first half of the 30-day interval, and it remains the lowest of the three series at every measurement after day 0.
Small vertical error bars accompany all three sets of measurements. These error bars are colored to correspond with their respective data series. They are relatively modest in size compared with the overall separation between the curves, so the broad visual pattern remains easy to distinguish. At later time points, there is substantial separation among the three conditions: at day 30, the blue series is near 55%, the green series near 30%, and the red series near 10%. This makes the contrast among the illustrated storage conditions especially apparent at the right side of the graph.
The composition uses large black serif typography for the main heading and subtitle, with similarly traditional serif lettering for the axis labels, tick values, and legend. The chart has generous margins and substantial white space around the plotting area. Circular markers make each observation easy to locate, while straight connecting line segments emphasize the downward trajectories. The use of blue, green, and red provides strong visual differentiation between the three data series without relying on branding or decorative imagery.
Overall, the image communicates a straightforward scientific concept: yeast cell viability in liquid culture decreases as storage time increases, and the depicted rate of decline differs substantially among the three temperature conditions. In the illustrated data, the culture represented as being stored at 4°C retains the largest proportion of viable cells throughout the 30-day period, the 10°C condition exhibits a more pronounced decline, and the 20°C condition exhibits the most rapid decline. The figure is designed primarily for immediate visual comparison of time-dependent viability trends rather than as a photographic depiction of yeast cells, laboratory equipment, or an experimental procedure.
The image is related to: Fermenting Beer with White Labs WLP039 East Midlands Ale Yeast